Pew Research Center conducted this study to better understand the experiences of U.S. adults in the workplace. This analysis is based on 5,188 U.S. adults who are working part time or full time, who are not self-employed, and who have only one job or have more than one but consider one to be their primary job.
The data was collected as part of a larger survey of workers conducted Feb. 6-12, 2023. Everyone who took part is a member of the Center’s American Trends Panel (ATP), an online survey panel that is recruited through national, random sampling of residential addresses. Address-based sampling ensures nearly all U.S. adults have a chance of selection. The survey is weighted to be representative of the U.S. adult population by gender, race, ethnicity, partisan affiliation, education and other categories. Read more about the ATP’s methodology.
Read more about the questions used for this report and the report’s methodology.
References to workers or employed adults include those who are employed part time or full time, who are not self-employed, and who have only one job or have more than one but consider one of them to be their primary job.
References to White, Black and Asian adults include only those who are not Hispanic and identify as only one race. Hispanics are of any race.
References to college graduates or people with a college degree comprise those with a bachelor’s degree or more. “Some college” includes those with an associate degree and those who attended college but did not obtain a degree.
“Middle income” is defined here as two-thirds to double the median annual family income for panelists on the American Trends Panel. “Lower income” falls below that range; “upper income” falls above it. Read the methodology for more details.
In the wake of the Great Resignation and amid reports of “quiet quitting,” only about half of U.S. workers say they are extremely or very satisfied with their job overall, according to a new Pew Research Center survey. Even smaller shares express high levels of satisfaction with their opportunities for training and skills development, how much they are paid and their opportunities for promotion.
At the same time, most workers say they are extremely or very satisfied with their relationship with their co-workers (67%) and with their manager or supervisor (62%). About seven-in-ten or more say they’re treated with respect (78%) and can be themselves at work (72%) all or most of the time, and majorities also say they have at least one close friend at work (65%) and that they feel their contributions at work are valued a great deal or a fair amount (62%).
Jump to:
The nationally representative survey of 5,902 U.S. workers, including 5,188 who are not self-employed, was conducted Feb. 6-12, 2023, using the Center’s American Trends Panel.1 In addition to exploring how workers feel about their current job and their experiences in the workplace, the survey also asked about workplace benefits, including whether employed adults use all of their paid time off, if available.
Related: About a third of U.S. workers who can work from home now do so all the time
Some key findings from the survey:
- Older workers offer the most positive assessments of their job. Two-thirds of workers ages 65 and older say they are extremely or very satisfied with their job overall, compared with 55% of those 50 to 64, 51% of those 30 to 49, and 44% of those 18 to 29. Older workers are the most likely to say they are extremely or very satisfied with their relationship with their manager or supervisor, their day-to-day tasks, and their opportunities for promotion at work. They also are more likely to say they find their job to be enjoyable and fulfilling all or most of the time.
- On many measures of workplace satisfaction, views differ widely by income. Workers with higher incomes are more likely than those with lower and middle incomes to say they are extremely or very satisfied with their job overall and to say the same about the benefits their employer provides, their opportunities for training and to develop new skills, how much they are paid, and their opportunities for promotion. Larger shares of upper-income workers also say the contributions they make at work are valued a great deal or fair amount, that their employer cares about their well-being at least a fair amount, and that the safety and health conditions at their workplace are excellent or very good (among those who do not work fully remotely).
- About four-in-ten workers (39%) say their job or career is extremely or very important to their overall identity. Roughly a third (34%) say it is somewhat important and 27% say it’s not too or not at all important. Workers with a postgraduate degree are the most likely to see their job or career as central to their overall identity – 53% say it is.
- Black workers are the most likely to say they’ve been discriminated against in the workplace because of their race or ethnicity. Some 41% of Black workers say that at some point they have experienced discrimination or been treated unfairly by an employer in hiring, pay or promotions because of their race or ethnicity (though not necessarily by their current employer). This compares with 8% of White workers, 20% of Hispanic workers and 25% of Asian workers. And while about a quarter of employed women (23%) say they have experienced discrimination because of their gender, only one-in-ten employed men say the same.
- Lower-income workers are less likely to have access to key employer-sponsored benefits. Large majorities of upper- and middle-income workers (80% or more) say their employer offers paid time off for vacations, doctor’s appointments and minor illnesses, health insurance, and retirement programs such as 401(k)s. Significantly smaller shares of lower-income workers (about two-thirds or fewer) say they have access to these benefits through their employer.
- Most workers place a high priority on paid time off. About six-in-ten workers (62%) say it’s extremely important to them personally to have a job that offers paid time off for vacations, routine doctor’s visits or to deal with minor illnesses, larger than the shares who say the same about having employer-paid health insurance (51%), an employer-sponsored 401(k) or other retirement program (44%) or paid parental, family or medical leave separate from their other paid time off (43%). But when those who place a high priority on more than one of these are asked which one would be the most important to them – and taking into account those who only prioritize one of these benefits – health insurance stands out as the most important benefit for workers.
- Nearly half of workers who have paid time off say they typically take less time off than their employer offers. About half of these workers say they don’t feel they need to take more time off (52%) or worry they might fall behind at work if they took more time off (49%). Some 43% say they feel badly about their co-workers taking on additional work, while smaller shares cite concerns that taking more time off might hurt their chances for job advancement (19%) or that they might risk losing their job (16%) or say their manager or supervisor discourages them from taking time off (12%).
How workers see their job
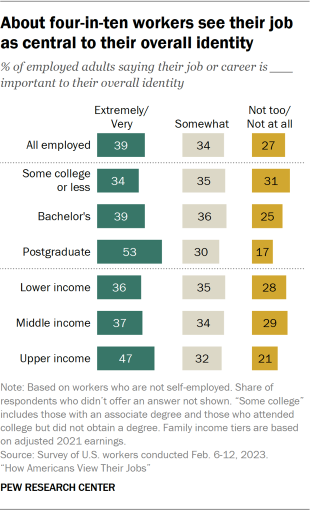
About four-in-ten workers who are not self-employed (39%) say their job or career is extremely or very important to their overall identity; 34% say it’s somewhat important and 27% say it’s not too or not at all important.
Workers with higher family incomes and those with a postgraduate degree are the most likely to say their job or career is central to their identity. Some 47% of workers with higher family incomes say this, compared with 37% of those with middle incomes and 36% of workers with lower family incomes. And while 53% of workers with a postgraduate degree say their job or career is extremely or very important to their identity, smaller shares of those with a bachelor’s degree (39%) or with some college or less education (34%) say the same.
The shares of workers who see their job or career as central to their overall identity don’t vary significantly by gender, race or ethnicity, or age.
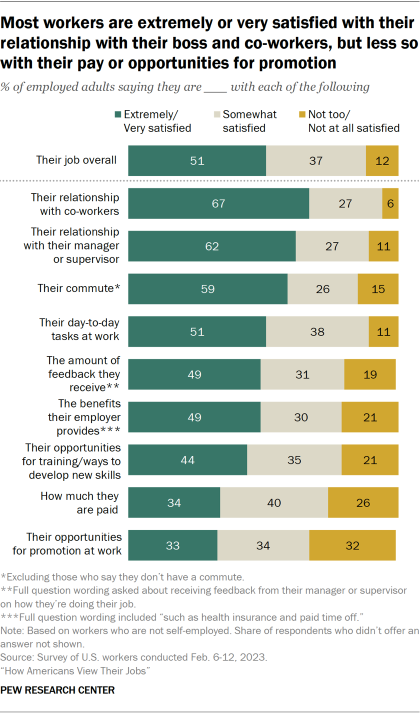
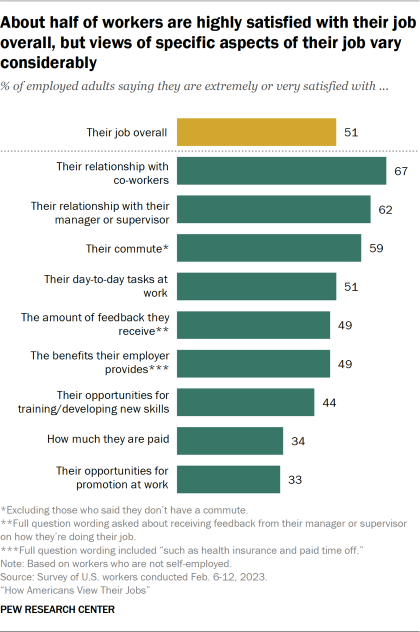
When it comes to assessments of job satisfaction, about half of U.S. workers who are not self-employed (51%) report being extremely or very satisfied with their job overall; 37% say they are somewhat satisfied, while 12% are not too or not at all satisfied with their job.
Views vary considerably when workers are asked about specific aspects of their job. Two-thirds say they are extremely or very satisfied with their relationship with their co-workers, and 62% say the same about their relationship with their manager or supervisor. About six-in-ten workers who commute to work (59%) are also highly satisfied with their commute.
About half of workers say they are extremely or very satisfied with their day-to-day tasks (51%), the amount of feedback they receive from their manager or supervisor on how they’re doing their job (49%), and the benefits their employer provides, such as health insurance and paid time off (49%).
Some 44% are extremely or very satisfied with their opportunities for training and ways to develop new skills, while only about a third say the same about how much they are paid (34%) and their opportunities for promotion (33%).
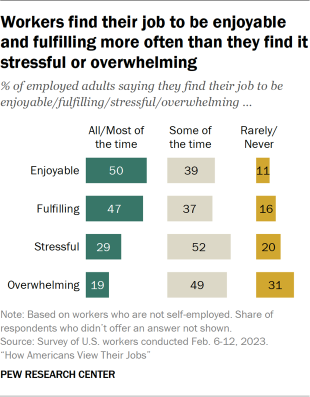
Similar to the share who say they are extremely or very satisfied with their job overall, half of workers say they find their job to be enjoyable all or most of the time, and 47% say it is fulfilling. Smaller but substantial shares say their job is stressful (29%) and overwhelming (19%) all or most of the time.
Older workers and those with higher family incomes have more positive views of their job
Workers ages 65 and older are the most likely to say they are extremely or very satisfied with their job overall (67%) – and adults younger than 30 are the least likely to say this (44%). A narrow majority of workers 50 to 64 (55%) and about half of those 30 to 49 (51%) say they are extremely or very satisfied with their job.
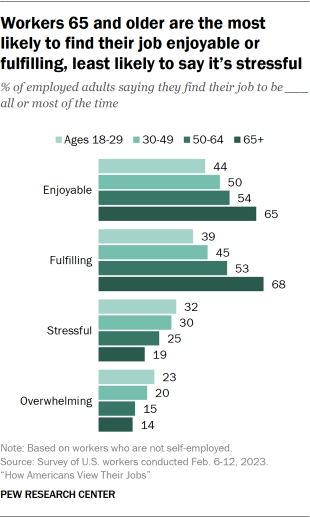
Older workers are also the most likely to say they are extremely or very satisfied with their relationship with their manager or supervisor (73% of workers 65 and older say this), their day-to-day tasks (70%), and their opportunities for promotion (43%).
About two-thirds of workers ages 65 and older say their job is fulfilling (68%) and enjoyable (65%) all or most of the time, larger than the shares of workers in each of the three younger age groups who say the same. In turn, workers younger than 50 are more likely than their older counterparts to say their job is stressful and overwhelming all or most of the time.
Workers 65 and older make up a relatively small share of the labor force – 7% in 2022, according to Pew Research Center analysis of Current Population Survey data.
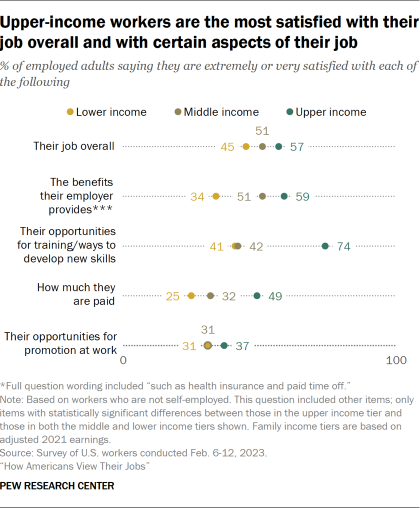
Job satisfaction also differs by income. A majority (57%) of those with higher family incomes say they are extremely or very satisfied with their job overall, compared with 51% of those with middle incomes and 45% of those with lower incomes. And those with higher incomes are also more likely than middle- and lower-income workers to express high levels of satisfaction with the benefits their employer provides; their opportunities for training or ways to develop new skills; how much they are paid; and their opportunities for promotion at work. In the case of employer benefits and pay, middle-income workers are also significantly more likely than lower-income ones to say they are extremely or very satisfied.
Workers’ views of whether their job is enjoyable, stressful or overwhelming all or most of the time vary little across income levels. But those with higher incomes are the most likely to say they find their job to be fulfilling all or most of the time: 53% say this, compared with 47% of those with middle incomes and a smaller share (40%) of those with lower incomes. Workers with a postgraduate degree (56%) are also more likely than those with a bachelor’s degree (47%) and with some college or less education (44%) to say they find their job to be fulfilling all or most of the time.
For the most part, men and women express similar levels of satisfaction with their job overall and with specific aspects of their job, but there are two exceptions. Men are more likely than women to say they are extremely or very satisfied with the benefits their employer provides (52% of men vs. 46% of women) and with how much they’re paid (39% vs. 30%). And while men and women are about equally likely to say their job is enjoyable and fulfilling all or most of the time, women are more likely to say it’s stressful (31% vs. 26%) and overwhelming (24% vs. 15%) all or most of the time.
For the most part, satisfaction with various aspects of work don’t vary widely by race and ethnicity, but there are some differences. A larger share of White workers (37%) than Black (29%), Hispanic (29%) or Asian (28%) workers say they are extremely or very satisfied with how much they are paid. White workers are more likely than Black and Asian workers to be highly satisfied with their relationship with their co-workers (69% vs. 58% and 60%, respectively) and with their manager or supervisor (64% vs. 56% and 54%).
How workers are experiencing the workplace
Workers largely report positive experiences in the workplace, with at least six-in-ten of those who are not self-employed saying they are treated with respect at work all or most of the time (78%), can be themselves at work all or most of the time (72%), have at least one close friend at work (65%) and feel that the contributions they make at work are valued a great deal or a fair amount (62%).
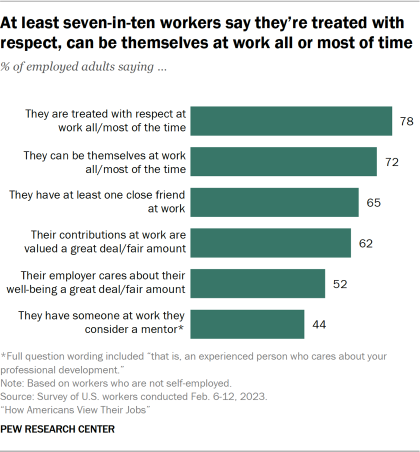
About half (52%) say their employer cares about their well-being a great deal or a fair amount; 28% say their employer cares some and one-in-five workers say their employer doesn’t care much or at all. A majority of workers (55%) say they don’t have someone at work who they consider a mentor.
These experiences vary in some ways by gender, race and ethnicity, age, and income. For example, 70% of upper-income workers say the contributions they make are valued a great deal or a fair amount, compared with 62% of those with middle incomes and a smaller share (56%) of those with lower incomes. And while 66% of White workers say their contributions are valued a great deal or fair amount, smaller shares of Hispanic (57%), Black (55%) and Asian (54%) workers say the same.
White workers (75%) are also more likely than Hispanic (69%), Black (69%) and Asian (60%) workers to say they can be themselves at work all or most of the time, although majorities across groups say this (the difference between Asian workers and Black and Hispanic workers is not statistically significant). There are also differences by age on this question, although majorities of 68% or more across age groups say they can be themselves at work all or most of the time. Workers 65 and older are the most likely to say this; 88% in this age group say they can be themselves at work at least most of the time.
More than half of workers ages 18 to 29 (56%) say they have a mentor at work, compared with 46% of those 30 to 49 and only about a third of workers 50 to 64 (34%) and 65 and older (33%). Meanwhile, those in the oldest group are the most likely to say their employer cares about their well-being a great deal or a fair amount (61% of those 65 and older say this vs. about half in each of the three younger groups).
Women (68%) are more likely than men (62%) to say they have at least one close friend at work, although majorities of both groups say this. Women are also more likely to say they have a mentor at work (48% of women vs. 41% of men).
Workers who receive regular feedback are more satisfied with the amount of feedback they receive and their relationship with their boss
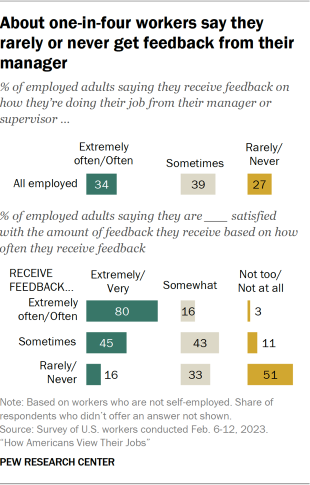
About a third of workers (34%) say they receive feedback on how they’re doing their job from their manager or supervisor extremely often or often; 39% say they sometimes receive feedback and 27% say they rarely or never do. These answers don’t vary significantly by gender, race or ethnicity, age, or income.
The survey suggests that workers embrace feedback: 80% of those who say they receive feedback extremely often or often also say they are extremely or very satisfied with the amount of feedback they receive from their manager or supervisor, compared with 45% of those who sometimes receive feedback and just 16% of those who rarely or never do. And while 84% of workers who regularly get feedback say they are extremely or very satisfied with their relationship with their manager or supervisor, 62% of those who sometimes get feedback and just 36% of those who rarely or never receive it say the same.
About three-in-ten workers say they respond to work emails and messages outside of work hours extremely often or often
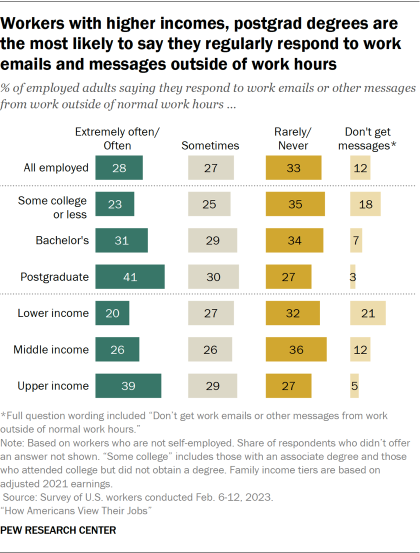
More than half of workers (55%) say they respond to work emails or other messages from work outside of their normal hours at least sometimes, with 28% saying they do so extremely often or often; 33% say they rarely or never respond to work emails or messages outside of their work hours.
Workers with higher incomes (39%) are more likely than those with middle (26%) or lower (20%) incomes to say they respond to work emails or other messages from work outside of their normal hours extremely often or often. Similarly, 41% of workers with a postgraduate degree say they do this, compared with 31% of those with a bachelor’s degree and 23% of those with some college or less education.
Lower-income workers and those without a four-year college degree are more likely than those with middle and upper incomes and those with at least a bachelor’s degree to say they don’t receive emails or other messages from work outside of their work hours.
Lower-income and Black and Hispanic workers are among the most likely to say safety conditions where they work are fair or poor
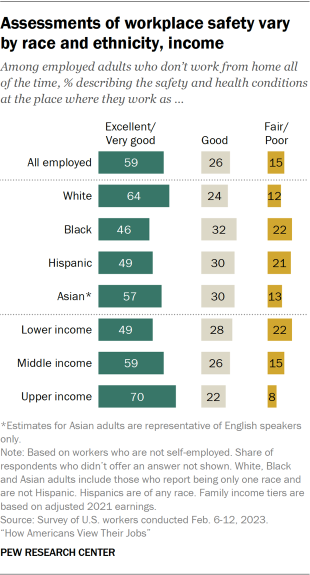
Among workers who are not self-employed and who do not have fully remote jobs, about six-in-ten (59%) say the safety and health conditions at the place where they work are excellent or very good; 26% say these conditions are good and 15% say they are fair or poor.
Seven-in-ten upper-income workers rate the conditions at their workplace as excellent or very good, compared with 59% of those with middle incomes and just about half (49%) of workers with lower incomes. Roughly one-in-five lower-income workers (22%) describe the safety and health conditions at their workplace as fair or poor; 15% of those with middle incomes and an even smaller share of higher-income workers (8%) do so.
These assessments also vary by race and ethnicity. Black (22%) and Hispanic (21%) workers are more likely than White (12%) and Asian (13%) workers to say the safety and health conditions at their workplace are fair or poor.
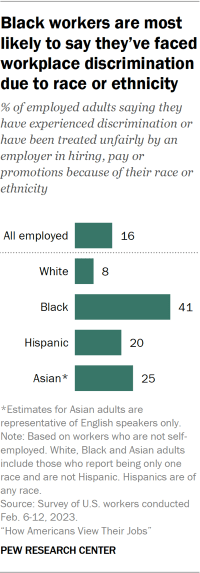
About four-in-ten Black workers say they have experienced discrimination or been treated unfairly by an employer because of their race or ethnicity
While most questions in this survey asked workers about their current job, the survey also asked respondents if they have experienced discrimination or been treated unfairly by any employer in hiring, pay or promotions because of their race or ethnicity or because of their gender.
Black workers are the most likely to report that they’ve experienced discrimination or have been treated unfairly by an employer because of their race or ethnicity: 41% of Black workers say this has happened to them, compared with 25% of Asian workers, 20% of Hispanic workers and just 8% of White workers.
Among Black workers, men (48%) are more likely than women (36%) to say they’ve experienced this type of discrimination. There are no gender differences among White and Hispanic workers (the number of Asian workers in the sample is too small to analyze men and women separately).
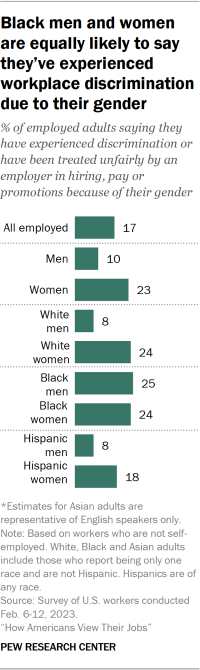
When asked if they have been discriminated against or been treated unfairly by an employer in hiring, pay or promotions because of their gender, about a quarter of women (23%) – compared with 10% of men – say this has happened to them. White, Black and Hispanic women are about equally likely to say they’ve experienced this type of treatment because of their gender. However, Black men (25%) are far more likely than White and Hispanic men (8% each) – and as likely as Black women – to say they’ve had these experiences because of their gender.
Access to and importance of employer-sponsored benefits
About eight-in-ten workers who are not self-employed (82%) say their employer offers paid time off for vacations, routine doctor’s appointments or to deal with minor illnesses. A similar share (79%) say they are offered health insurance through their employer, and 77% say they have access to an employer-sponsored 401(k) or other retirement savings program. Fewer workers (57%) say they have access to paid parental, family or medical leave, beyond what they are given for vacation or sick leave.
Access to these benefits differs widely by income. Large majorities of upper- and middle-income workers (91% and 86%) say their employer offers paid time off for vacations, doctor’s appointments and minor illnesses. About two-thirds of lower-income workers say the same.
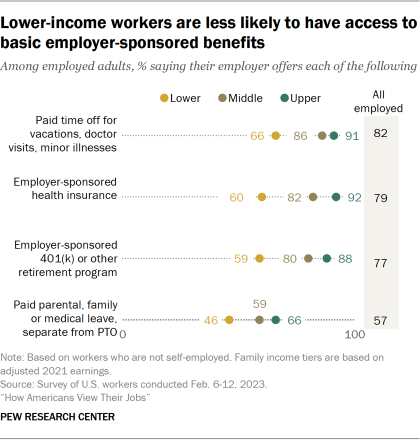
When it comes to employer-sponsored health insurance and retirement programs, about nine-in-ten upper-income workers say their employer offers these benefits (92% have health insurance and 88% have a retirement plan). By comparison, about eight-in-ten middle-income workers have health insurance (82%) or a retirement plan (80%). Smaller shares of lower-income workers have these benefits: 60% have health insurance and 59% have a 401(k)-type plan.
This pattern persists for paid family and medical leave. While 66% of upper-income workers say their employer offers paid parental, family or medical leave (beyond basic vacation and sick leave), fewer middle- and lower-income workers say they have the same benefit (59% and 46%, respectively).
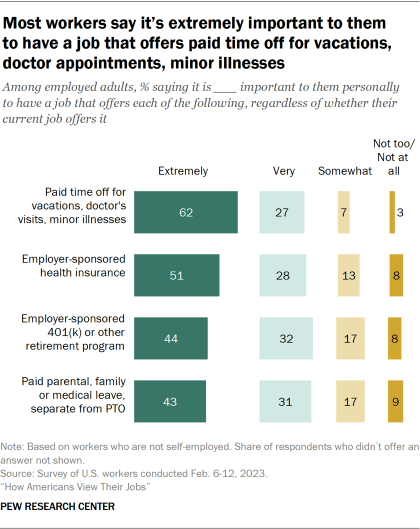
Regardless of whether their employer provides it, a majority of workers (62%) say it’s extremely important to them to have a job that offers paid time off for vacations, routine doctor’s appointments or to deal with minor illnesses. An additional 27% say this is very important to them.
About half of workers (51%) say it’s extremely important to them to have a job that offers employer-sponsored health insurance; 28% say this is very important. Some 44% of workers say it’s extremely important to them to have a job that offers an employer-sponsored retirement program, such as a 401(k), with 32% saying this is very important to them. Similarly, 43% say it’s extremely important to them to have paid parental, family or medical leave (31% say this is very important).
Workers with a four-year college degree or more education place more importance on having paid time off, employer-sponsored health insurance and a 401(k) or other retirement program than do workers with less education. The same is true of upper-income workers – they place more importance on these benefits than middle- and lower-income workers. When it comes to paid parental, family and medical leave, the differences by income are smaller and there are no significant differences by education.
In general, workers who have these benefits tend to place more importance on them, and the gaps in views between those who do and don’t receive these benefits are quite large in some instances. For example, 58% of workers who say their employer offers health insurance say it’s extremely important for them to have a job with this benefit. By contrast, 27% of those who don’t have a job that offers health insurance say this is equally important to them. Similarly, while 50% of workers who have access to an employer-sponsored retirement plan say it’s extremely important to them to have a job that offers this benefit, 25% of those who don’t have this benefit say the same. It may be that some workers place less importance on these benefits because they don’t currently have them. In the case of health insurance, it is possible that some don’t rely on their jobs for it.
Workers who place a high priority on more than one of these benefits were asked which one would be the most important to them. Taking into account their responses and those of workers who only prioritize one benefit, health insurance tops this list. Some 43% rank health insurance as the most important benefit to have. Smaller shares prioritize paid time off for vacations and routine doctor’s appointments or minor illnesses (29%), an employer-sponsored retirement plan (13%) or paid family or medial leave (8%) over other benefits.
Nearly half of workers don’t take all the paid time off their employer offers
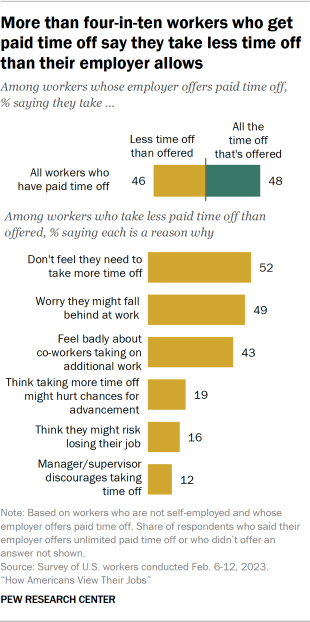
Among workers who say their employer offers them paid time off for vacation, doctors’ appointments or to deal with minor illnesses, 48% say they typically take all the time off they are offered, while 46% say they take less time off than they are allowed. There are modest differences by income and education in how much time off workers take. Upper-income workers and those with a bachelor’s degree or more education are more likely to say they take less time off than their employer offers. About half (51%) of four-year college graduates say this compared with 41% of those with less education.
When workers who don’t take all of the paid time off they are offered are asked why they don’t, some reasons resonate much more than others. About half (52%) say they don’t feel they need to take more time off. A similar share (49%) say they worry about falling behind at work if they were to take more time off. Some 43% say they would feel badly about their co-workers having to take on additional work.
Fewer say they think taking more time off might hurt their chances for advancement at work (19%) or think they might risk losing their job (16%). About one-in-ten (12%) say their manager or supervisor discourages them from taking time off.
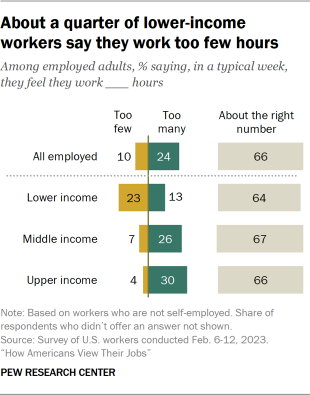
Most workers say they are satisfied with the number of hours they work in a typical week. About two-thirds (66%) say they feel they work about the right number of hours each week, 24% say they work too many hours and 10% say they work too few.
There are differences by income. While majorities from each income group say they work about the right number of hours in a typical week, lower-income workers (23%) are more likely than middle- (7%) and upper-income (4%) workers to say they work too few hours in a typical week. Upper- and middle-income workers are more likely to say they work too many hours (30% and 26%, respectively, vs. 12% of lower-income workers).