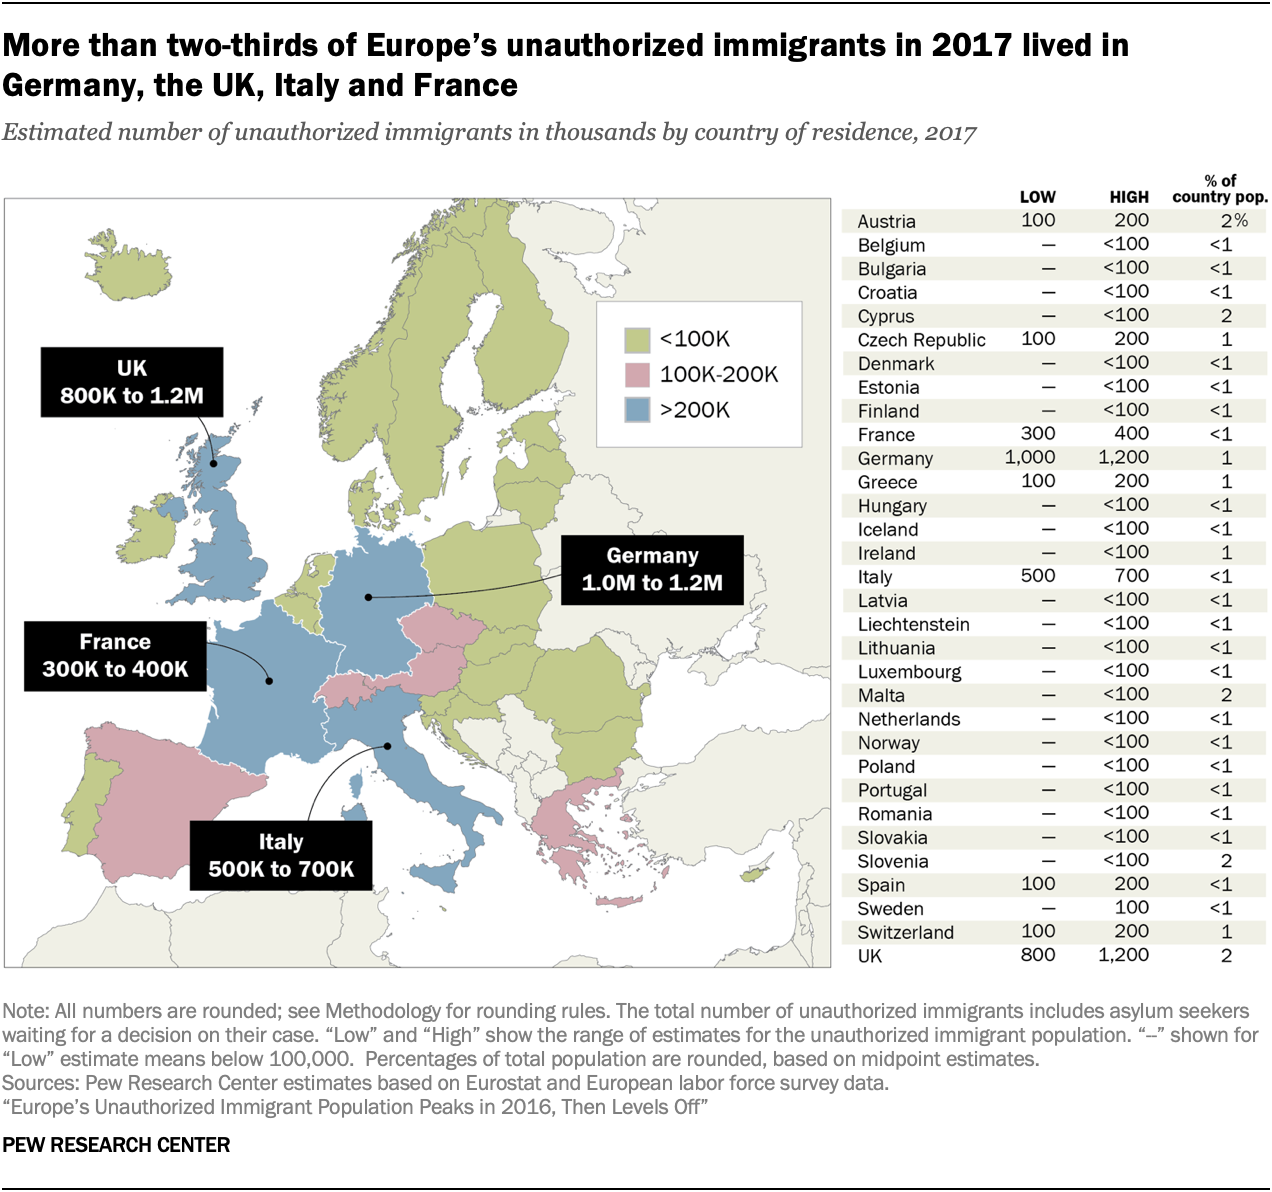
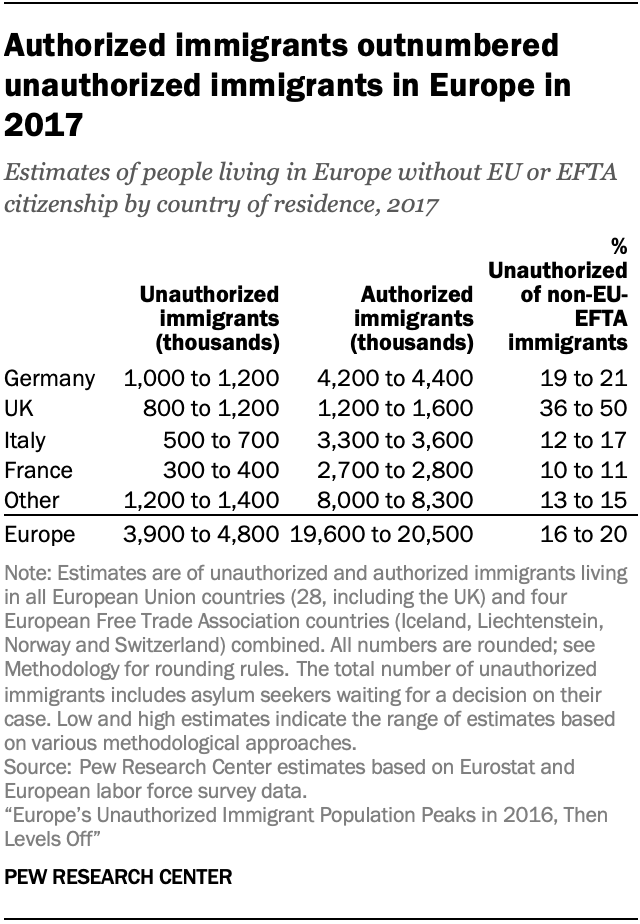
While each of the 32 nations in the EU and EFTA had some unauthorized immigrants in 2017, the largest numbers were in Germany and the United Kingdom, amounting to about half of Europe’s total. Substantial shares also lived in Italy and France. Together, these four countries were home to more than two-thirds (70%) of Europe’s unauthorized immigrants. By comparison, Germany, the UK, Italy and France accounted for slightly more than half of Europe’s total population in 2017.

How we estimated the number of unauthorized immigrants in Europe
We used four different methods to estimate the unauthorized immigrant population in Europe:
- Residual method – the total number of authorized immigrants in a country subtracted from the total number of non-EU-EFTA citizens – is the primary method used to estimate the size of the unauthorized immigrant population in EU-EFTA countries. This is the method used for countries where estimates show six-in-ten (60%) of Europe’s unauthorized immigrant population resided in 2017. This approach has been used by Pew Research Center and other research organizations in the United States for many years to estimate the size of the U.S. unauthorized immigrant population. In Europe, the “residual” method has previously been used by other researchers, including some country-level estimates published by the Clandestino project in 2008.
- Demographic components method, where the unauthorized immigrant population is demographically updated from the last reliable estimate published in 2008 (17% of Europe’s unauthorized immigrants were in these countries in 2017).
- Regularization method (accounting for 3% of Europe’s unauthorized immigrants in 2017), where counts of unauthorized immigrants who moved from an unauthorized to an authorized status in prior years provide an indication of the minimum number of unauthorized immigrants who lived in the country.
- Proportional ratio method (20% of unauthorized immigrants in 2017 lived in countries where this method was used), which relies on a proxy ratio of unauthorized immigrants to total non-EU-EFTA citizens from countries with similar immigration patterns. These types of methods were also employed by the Clandestino project in 2008 with about the same proportions for the total Europe-wide estimate of the unauthorized immigrant population published then. For more on our methods, see the report’s methodology, our methodology video and a methods Q&A with our researchers.
A range of estimates are presented to reflect different data, methodological approaches and adjustments in estimating the size of the unauthorized immigrant population in each European country. Our estimates of the unauthorized immigrant population in Europe include annual estimates for 2014 to 2017. The year 2014 was the first year Eurostat, Europe’s statistical agency, began releasing noncitizen population numbers for every European country, a needed component for the estimation methods used in this report.

Between 1.0 million and 1.2 million unauthorized migrants were estimated to live in Germany in 2017, with roughly the same number (800,000 to 1.2 million) in the UK. Meanwhile, between 500,000 and 700,000 are estimated to have lived in Italy and another 300,000 to 400,000 lived in France that year. In each of these countries, anywhere from less than 1% to slightly more than 2% of country populations were estimated to be unauthorized immigrants in 2017.
Among noncitizens, authorized immigrants outnumbered unauthorized immigrants in 2017. An estimated four times as many authorized (19.6 million to 20.5 million) as unauthorized immigrants (3.9 million to 4.8 million) lived in Europe in 2017. That ratio was about the same in Germany, while it was closer to one-to-one in the UK. Meanwhile, the estimated ratio of authorized to unauthorized non-EU-EFTA citizens is much higher in France (nearly nine times as many), Italy (nearly six times as many) and all other EU-EFTA countries as a combined group (about six times as many).
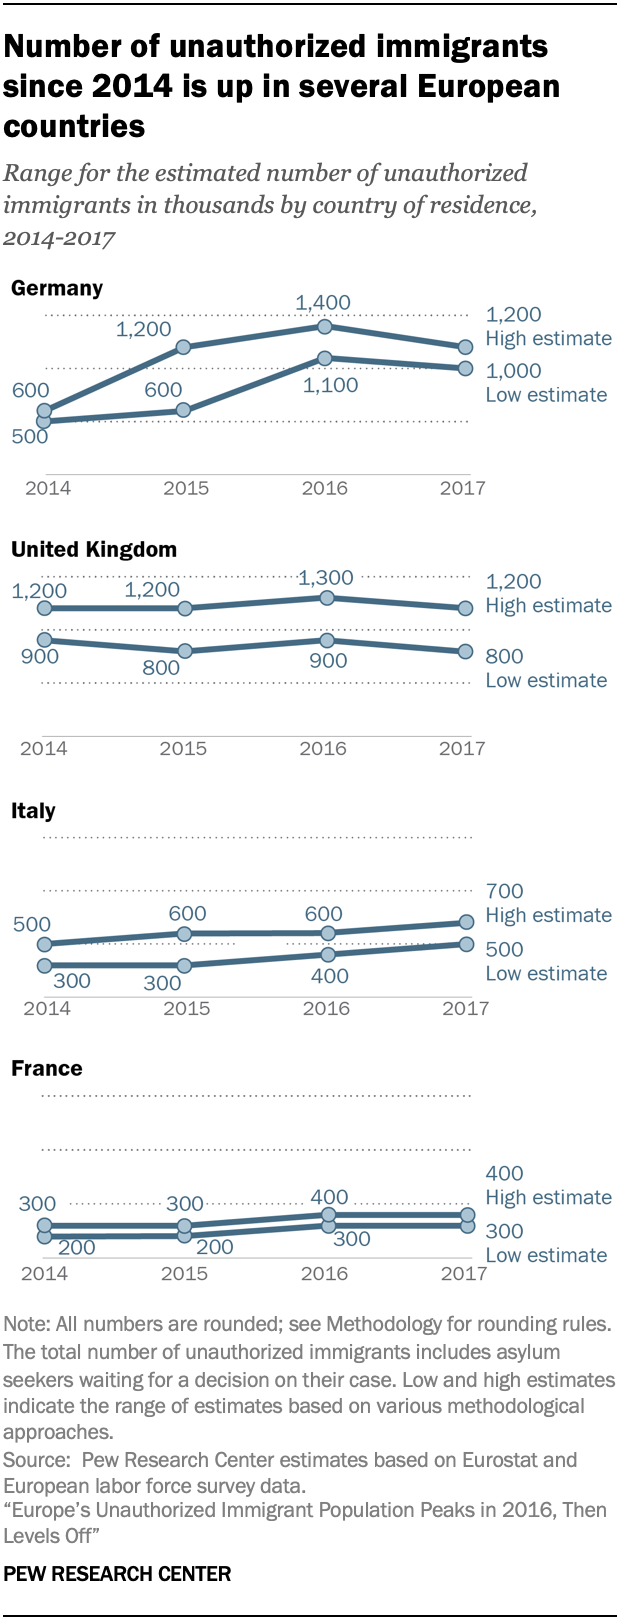
In many, though not all European countries, the number of unauthorized migrants residing in them increased between 2014 and 2016. For some, the unauthorized migrant population peaked in 2016 and then either leveled off or fell in 2017.
In Germany, the number of unauthorized immigrants roughly doubled between 2014 and 2016, when it reached a peak of 1.1 million to 1.4 million. By 2017, the population appeared to decline slightly (1.0 million to 1.2 million), though it is within the broader 2016 range. Consequently, the range of estimates indicates no sizable change between 2016 and 2017. Similarly, the trend for Germany’s unauthorized immigrant population when not including asylum seekers waiting for a decision on their case also peaked in 2016, to between 500,000 and 800,000, before appearing to decline slightly in 2017. (See Appendix C for estimates of the size of Germany’s unauthorized immigrant population without asylum seekers waiting for a decision.)

By contrast, the UK estimates show little change between 2014 (900,000 to 1.2 million) and 2017 (800,000 to 1.2 million) in the number of unauthorized immigrants. With such a wide range, however, it is possible that a change in the population size happened during this period. Notably the UK was not a top destination for the recent 2015 surge of asylum seekers in Europe. As a result, most of the UK’s unauthorized immigrant population is likely people who have overstayed their visas or asylum seekers who have remained in the UK after not seeing their cases approved.
In Italy, the estimated number of unauthorized immigrants increased between 2014 and 2017. This might be due to a continued flow of asylum seekers arriving in Italy through 2017, as well as tighter border inspections by Italy’s northern and western neighbors that has kept some asylum seekers from moving on to other European countries. If asylum seekers waiting for a decision on their applications are excluded from the total, there was only a marginal increase in the number of unauthorized immigrants in Italy between 2014 and 2017 (see Appendix C for estimates without waiting asylum seekers).
In France, a similar peak in estimates occurred in 2016, but the total did not decline through 2017. Some 300,000 to 400,000 unauthorized immigrants are estimated to have lived in France in 2017, up from 200,000 to 300,000 in 2014. Compared with other large immigrant destinations in Europe, France has a relatively lower number of unauthorized immigrants.
A possible reason for this is that some unauthorized immigrants can obtain authorized residency after living there for several years when meeting certain criteria.
Fewer than a third of Europe’s unauthorized immigrants in 2017 lived in the other 28 EU-EFTA countries. This amounted to an estimated 1.2 million to 1.4 million people. Among these countries, many had fewer than 100,000 unauthorized immigrants in 2017. Others, like Austria, the Czech Republic, Greece, Spain and Switzerland, had an estimated 100,000 to 200,000 unauthorized immigrants in 2017.
The combined number of unauthorized immigrants living in these 28 countries also increased since 2014 (when there were an estimated 1.0 million to 1.1 million), peaking in 2016 (1.3 million to 1.7 million) before appearing to decrease in 2017 (1.2 million to 1.4 million). The same pattern is true if waiting asylum seekers are not included. For this smaller combined group, the estimated number of unauthorized migrants increased between 2014 (700,000 to 900,000) and 2017 (900,000 to 1.2 million). (Annual estimates for the number of unauthorized immigrants living in each European country between 2014 and 2017 can be found in Appendix B. See Appendix C for estimates of the unauthorized immigrant population when not including waiting asylum seekers.)


