
Most Americans say they know at least some of their neighbors, but only about three-in-ten say they know all or most of them. Rural residents are more likely than those in urban or suburban areas to say they know all or most of their neighbors, but they don’t necessarily interact with their neighbors more than their counterparts in other community types.
Overall, Americans tend to be trusting of their neighbors, but this is particularly the case in suburban and rural areas. About six-in-ten in these types of community say they have a neighbor they would trust with a key to their home, compared with about half in urban areas.
When asked to describe their neighbors, people in rural areas are far more likely than those in cities and suburbs to say all or most of their neighbors share their race or ethnicity. Suburbanites are somewhat more likely than their urban and rural counterparts to say their neighbors are the same social class as they are, while relatively few across community types say all or most of their neighbors share their political views.
Rural residents are the most likely to know their neighbors
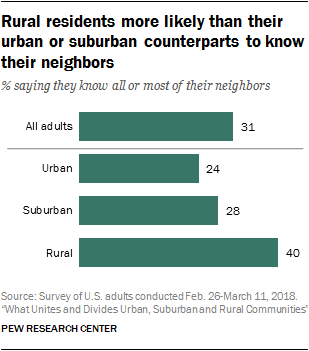
Four-in-ten rural residents say they know all or most of their neighbors; the shares are smaller among those living in urban (24%) and suburban (28%) areas.
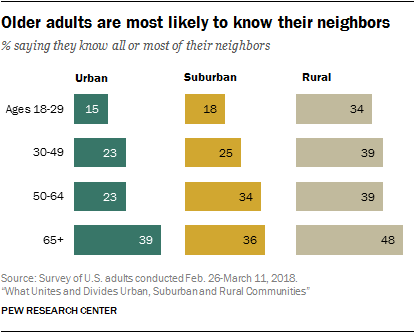
Across community types, Americans ages 65 and older are substantially more likely than their younger counterparts to say they know all or most of their neighbors. The oldest urban residents are 24 percentage points more likely than those ages 18 to 29 to say they know all or most of their neighbors (39% vs. 15%); that gap is 18 points among suburban residents (36% vs. 18%) and 14 points among rural residents (48% vs. 34%). Young adults ages 18 to 29 in rural areas are about twice as likely to say they know all or most of their neighbors as young adults in urban and suburban areas.
There are some differences by social class in the suburbs: 36% of suburbanites who say they are upper class and 31% of those who identify as middle class say they know all or most of their neighbors, compared with 20% of those who say they are lower class. There are no statistically significant differences across social classes in urban or rural areas.
Interactions with neighbors don’t vary much by community type
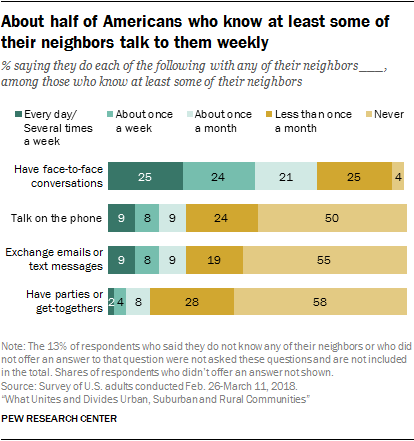
Among Americans who know at least some of their neighbors, one-in-four say they have face-to-face conversations with them at least several times a week. An additional 24% say they have these conversations about once a week, 21% say about once a month and 25% say less often than that. An additional 4% of those who know at least some of their neighbors say they never talk to them face-to-face.
Other forms of interacting with neighbors occur less often. Some 17% of those who know their neighbors say they exchange emails or text messages with them at least weekly, while 9% say they do this monthly, 19% say less often and 55% never do this. Similarly, 16% of those who know their neighbors talk on the phone with them on a weekly basis, 9% say they do this once a month, 24% do it less often and 50% say they never do.
A majority of Americans who know their neighbors (58%) say they never have parties or get-togethers with them, though 28% say they do so less than once a month and 14% say they have get-togethers with their neighbors at least monthly.
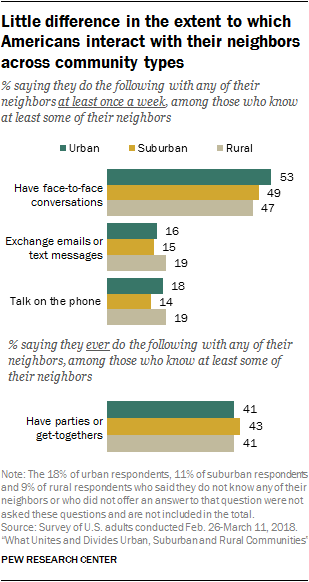
How often people interact with their neighbors does not vary much across different types of communities. Urban residents who know at least some of their neighbors are somewhat more likely than those in rural areas to say they talk to their neighbors face-to-face on a weekly basis, but about half in each community type say this is the case (53% in cities, 49% in suburbs and 47% in rural areas). Across community types, similar shares of adults who know at least some of their neighbors say they regularly exchange emails or text messages, talk on the phone or have parties or get-togethers with their neighbors.
Majority of Americans say they have a neighbor they would trust with a set of keys to their home
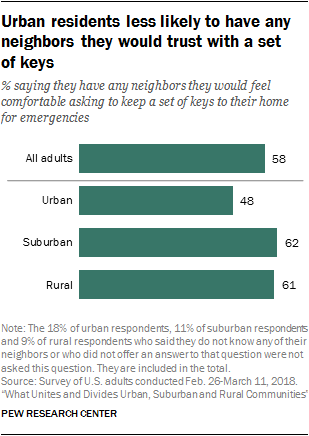
More than half of all U.S. adults (58%) say they have a neighbor they would feel comfortable asking to keep a set of keys to their home for emergencies (if they were locked out, for example).
Suburban (62%) and rural (61%) residents are more likely than their urban counterparts (48%) to say they would be comfortable with a neighbor having a set of keys to their home.
The longer people have lived in their community, the more likely they are to have a neighbor they would trust with a key to their home. But even among those who report that they have lived in their community for less than one year, 34% say they would be comfortable with a neighbor having their keys. Meanwhile, 64% of those who have lived in their community for six or more years and 47% of those who have done so for one to five years say the same. Those who own their home are more likely than renters to say they would be comfortable with a neighbor having a set of keys to their home (67% vs. 45%).
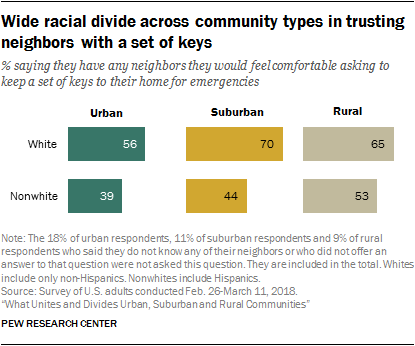
Across community types, white adults are more likely than nonwhites to say they would trust a neighbor to keep a set of keys to their home. In the suburbs, 70% of whites say they would feel comfortable with a neighbor having their keys, compared with 44% of nonwhites. In urban areas, 56% of whites say this compared with 39% of nonwhites; in rural areas, the shares are 65% and 53%, respectively.
Older people, those with more education and those who identify as upper class are the most likely to trust their neighbors with a set of keys. Still, race remains a significant factor even when controlling for these other demographics.
Rural residents are the most likely to say their neighbors share their race or ethnicity
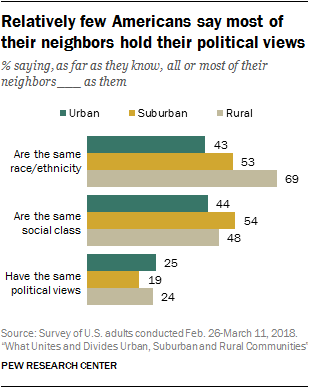
A slight majority of Americans (55%) say all or most of their neighbors are the same race or ethnicity as they are. Similarly, about half (49%) say their neighbors are mostly the same social class as them. A much smaller share (22%) say most of their neighbors share their political views – in fact, far more (45%) say only some or none of their neighbors have the same political views as them, while 28% say about half do. Perceptions of neighborhood racial, socioeconomic and political composition vary by community type.
Overall, whites are the most likely to say their neighbors share their race or ethnicity
About seven-in-ten people who live in rural areas (69%) say all or most of their neighbors are their same race or ethnicity, while much smaller shares of those in suburban (53%) and urban areas (43%) say the same.
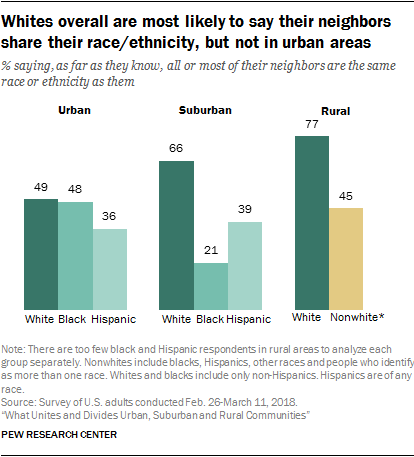
Overall, whites are much more likely than blacks and Hispanics to say their neighbors are mostly of the same race or ethnicity as they are. This pattern holds in suburban areas – where 66% of whites say all or most of their neighbors are of their race or ethnicity, compared with 21% of blacks and 39% of Hispanics – and in rural areas, where 77% of whites say their neighbors mostly share their race or ethnicity, compared with 45% of nonwhites.5 In urban areas, however, a different pattern emerges. Whites (49%) and blacks (48%) are equally likely to say most of their neighbors share their race or ethnicity, while 36% of Hispanics say the same.
Those with a bachelor’s degree or more education (60%) are more likely than those who did not complete a four-year degree (53%) to say all or most of their neighbors are of their race or ethnicity. While 81% of rural college graduates say all or most of their neighbors share their race or ethnicity, 66% of those with some college or less education say the same. In suburban areas, 58% of college graduates say their neighbors mostly share their race or ethnicity, compared with 50% of those who did not complete college. And half of urban college graduates say this, compared with 40% of those with some college or less education. These gaps persist even when looking only at white Americans.
In suburban and rural areas in particular, older people are more likely than their younger counterparts to say their neighbors mostly share their race or ethnicity. For example, eight-in-ten rural residents ages 65 and older say this, compared with 70% of those ages 50 to 64, 65% of those 30 to 49 and 60% of those 18 to 29. Again, this is true for rural adults even when accounting for the fact that younger residents are less likely to be white.
College graduates across community types are more likely to say their neighbors share their social class
When it comes to perceptions of whether their neighbors share their social class, the differences by community type are not quite as pronounced. Suburban residents (54%) are more likely than those in urban (44%) and rural (48%) areas to say, as far as they know, all or most of their neighbors are their same social class.
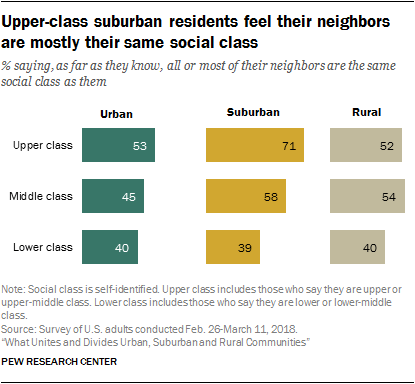
Suburban residents who identify as upper class stand out. Some 71% say most of their neighbors are their same social class. This is substantially higher than upper-class residents in other types of communities (53% of those in urban areas and 52% in rural areas) and suburban residents who say they are middle (58%) or lower (39%) class.
College graduates are the most likely to say their neighbors are like them in terms of social class, and this is true across community types. In urban areas, 55% of those with at least a bachelor’s degree say all or most of their neighbors are the same social class that they are, compared with 38% of those with some college or less education. Among suburban residents, 62% of college graduates and 50% of those with some college or less education say the same. In rural areas, the shares are 55% and 47%, respectively.
Relatively few Americans say most of their neighbors share their political views
Americans generally don’t think most of their neighbors have the same political views they do – about one-in-five (22%) say all or most do, while 33% say that only some and 12% say that none of their neighbors share their political views. Meanwhile, 28% say about half of their neighbors have their same political views.
The share saying all or most of their neighbors share their political views is somewhat higher among those in rural (24%) and urban (25%) areas – particularly those who say they live in a large city (32%) – than among suburban residents (19%).
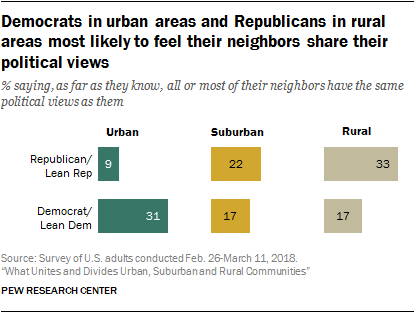
In urban areas, Democrats and Democratic-leaning independents are about three times as likely as their Republican or Republican-leaning counterparts (31% vs. 9%) to say all or most of their neighbors share their political views. In fact, among urban Republicans, 59% say only some or none of their neighbors share their political beliefs, while 40% of urban Democrats say the same; 29% and 25%, respectively, say about half of their neighbors share their political views.
In suburban areas, 22% of Republicans and 17% of Democrats say all or most of their neighbors share their political views, but there is a wide gap in the share of Democrats and Republicans who say only some or none of their neighbors do (50% vs. 39%).
Among rural residents, 33% of Republicans say their neighbors mostly share their political views, compared with 17% of Democrats. In turn, 57% of Democrats in rural areas say only some or none of their neighbors have the same political views that they do, while 34% of rural Republicans say the same.
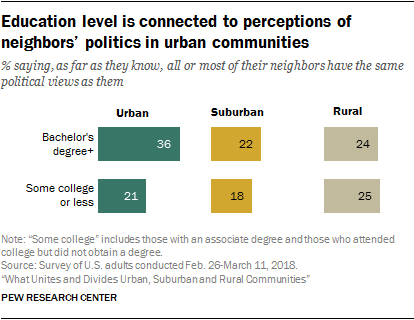
In urban communities, education is linked to perceptions of neighbors’ political views. Some 36% of city dwellers with a bachelor’s degree or more education say all or most of their neighbors share their political views, compared with 21% of those without a bachelor’s degree. This pattern is not evident among rural and suburban dwellers.
Neighbors tend to interact more if they’re of the same race, social class or political party
People who report that they share characteristics with their neighbors are also more likely to say they interact with their neighbors regularly, at least among some subgroups.
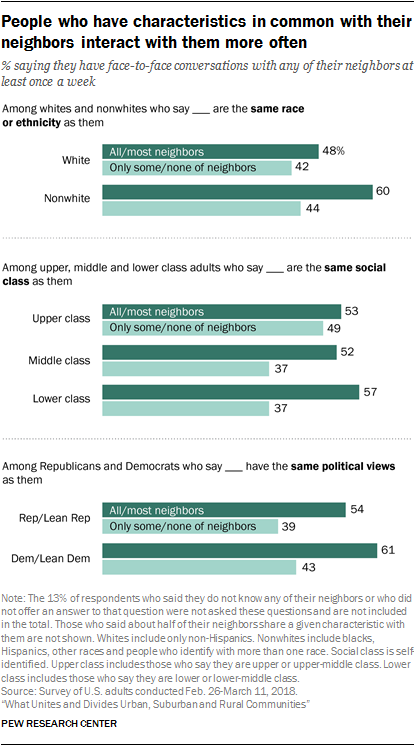
Overall, among those who know at least some of their neighbors, 51% who say all or most of their neighbors are their same race or ethnicity say they have face-to-face conversations with their neighbors at least once a week, compared with 43% of those who say only some or none of their neighbors share their race or ethnicity.
This is highly dependent on race. Among whites, those who say all or most of their neighbors are white (48%) are roughly equally likely as those who say only some or none of their neighbors are white (42%) to say they talk face-to-face with their neighbors at least weekly. Among nonwhites, though, 60% of those who say all or most of their neighbors share their race or ethnicity say they talk with them weekly, compared with 44% of those who say only some or none of their neighbors share their race or ethnicity.
When looking at Americans who are or are not in the same social class as their neighbors, a similar pattern appears. Overall, 54% of people who say all or most of their neighbors are the same social class as they are say they have face-to-face conversations with their neighbors once a week or more often, compared with 39% of those who say only some or none of their neighbors are their same social class.
However, this difference is only seen among those who consider themselves middle or lower class. For example, 52% of middle-class Americans who say most of their neighbors are also middle class say they have weekly face-to-face conversations with their neighbors; 37% of those who say only some or none of their neighbors are middle class say the same.
When it comes to political party, Republicans and Democrats alike are more likely to say they interact with their neighbors regularly if most of their neighbors share their political views than if only some or none of them do. Overall, 58% of those who say all or most of their neighbors have the same political views they do say they talk to their neighbors face-to-face weekly, compared with 42% of those who say only some or none of their neighbors share their views. The gaps are similar among Republicans (54% vs. 39%) and Democrats (61% vs. 43%).


