
The analysis in this report comes from two sources: 1) Pew Research Center analysis of the Census Bureau’s American Community Survey (IPUMS) and the 1990 and 2000 decennial censuses and 2) a nationally representative survey conducted from July 11 to Aug. 10, 2017, among a sample of 4,914 adults 18 years of age or older. The margin of error for the full sample is plus or minus 2.7 percentage points.
The survey was conducted by the GfK Group in English and Spanish using KnowledgePanel, its nationally representative online research panel. KnowledgePanel members are recruited through probability sampling methods and include those with internet access and those who did not have internet access at the time of their recruitment (KnowledgePanel provides internet access for those who do not have it and a device to access the internet when they join the panel, if needed). A combination of random-digit dialing (RDD) and address-based sampling (ABS) methodologies have been used to recruit panel members (in 2009 KnowledgePanel switched its sampling methodology for recruiting members from RDD to ABS).
KnowledgePanel continually recruits new panel members throughout the year to offset panel attrition as people leave the panel. All active members of the GfK panel were eligible for inclusion in this study.
Sample Design
The sample design for the survey was comprised of three groups: a group of about 2,500 panelists who said they were employed in a STEM occupation in a prior survey, a second group of about 1,900 panelists who were employed in a non-STEM occupation according to prior records, and a third group of about 500 eligible panelists to include other members of the general public including those who are not employed. Thus, the survey design oversamples employed adults and those employed in a science, technology, engineering or math occupation. In all, 8,995 panelists were invited to take part in the survey. The completion rate for this survey, that is the share of panelists invited to participate who completed the survey, was 62.9%. The cumulative response rate, calculated following Callegaro and DiSogra (2008), was 5%.41
All respondents were asked to verify their current employment status. Updated occupation information was collected for all employed adults who indicated that their main job had changed since the time of completing their profile survey.42 Most respondents who said they worked in a STEM occupation were also asked an open-end question to describe their occupation in more detail. These responses were used for final classification as employed in a STEM or non-STEM job where they were available.43
STEM occupations included the following job categories: computer and mathematical; architecture and engineering; life and physical sciences; medical doctors; other health care practitioners; health care technologists and technicians; and teachers (both K-12 and postsecondary) who specialize in a STEM subject.44Healthcare support occupations and all other occupational categories were classified as non-STEM jobs.
Note that since the survey was conducted in only English and Spanish, the sample of Asians working in STEM jobs are those with proficiency in English. There are not enough Asians working in non-STEM jobs for separate analysis in this survey.
Weighting
The data were weighted in a multistep process that begins with a base weight that accounts for differences in probability of selection into the study. Respondents were divided into four mutually exclusive subgroups 1) STEM workers, excluding STEM teachers 2) non-STEM workers, excluding non-STEM teachers 3) Teachers, both STEM and non-STEM 4) Non-workers. Each of these groups was separately weighted using an iterative technique to match population benchmarks. Next, the weighting combined all workers and aligned the combined group to population benchmarks for all workers.45 In a final step, workers (both STEM and non-STEM) were combined with non-workers, and the weights were further adjusted so that each group’s relative proportions and demographic profile matched estimates for all U.S. adults. At each stage, the resulting weights were trimmed and scaled to the number of completed surveys.
Population benchmarks included: gender by age, race/ethnicity, education, household income, region by metropolitan status, and primary language. Primary language parameters come from the Census Bureau’s 2015 American Community Survey; all other parameters come from the March 2016 Current Population Survey (CPS).
Variance estimation
Sampling errors and tests of statistical significance take into account the effect of weighting at each of these stages.
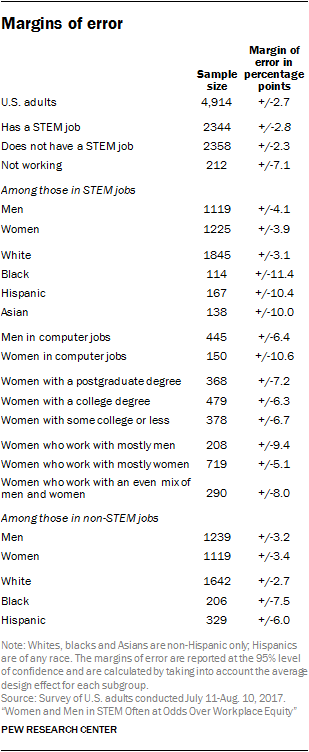
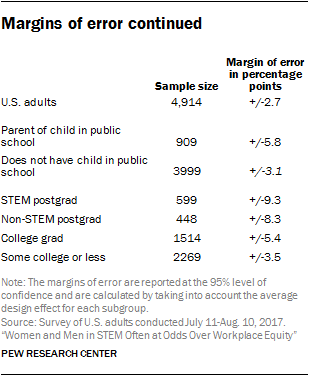
The tables show the unweighted sample sizes and the error attributable to sampling that would be expected at the 95% confidence level.
Sample sizes and sampling errors for other subgroups are available upon request.
In addition to sampling error, one should bear in mind that question wording and practical difficulties in conducting surveys can introduce error or bias into the findings of opinion polls.
Pew Research Center is a nonprofit, tax-exempt 501(c)(3) organization and a subsidiary of the Pew Charitable Trusts, its primary funder.


