Entrepreneurship and the role it plays in job creation is an issue of keen interest to policymakers. Self-employed workers, who work for profit or fees in their own business, encompass many of the nation’s entrepreneurs.1 Although much is known about how many and which workers are self-employed, far less is known about their job creation activities. This report attempts to fill this gap with estimates of the number of workers on the payrolls of the self-employed in 2014 and how job creation varies with these business owners’ demographic characteristics.2
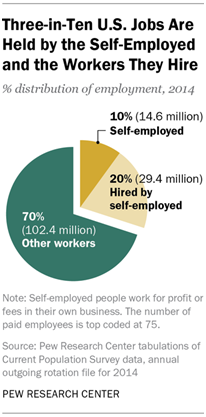
Not all self-employed workers are job creators, however. Only about one-in-four of them (3.4 million) said they usually have at least one paid employee. Hiring is typically small-scale. Self-employed workers with employees had a median of three paid employees in 2014 and an average of 8.6 employees.3
Moreover, hiring by self-employed workers varies markedly by the type of business they operate.4 Most job creation by the self-employed—22.5 million out of 29.4 million—flowed from those with incorporated businesses. While most self-employed workers owned unincorporated businesses, those with incorporated businesses were three times as likely to employ others for pay, by 41% to 13%. And among self-employed workers with paid employees, those with incorporated businesses hired more workers, on average, than the unincorporated (10.2 versus 5.6 workers).
Because of the newness of the data it is not possible to know whether the number of paid employees working for businesses run by the self-employed in 2014 is greater or less than in the past. However, two trends point to a potential decline.
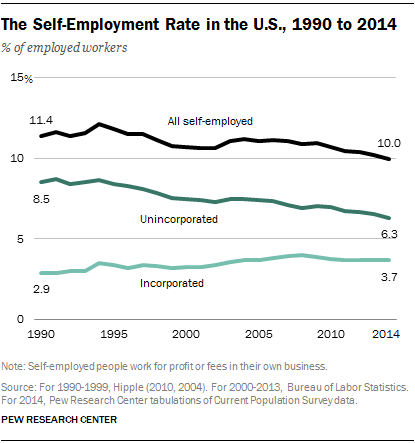
First, the share of American workers who are self-employed has decreased, from 12.2% in 1994, the most recent peak, to 10% in 2014. However, in a countervailing trend, there has been a shift toward incorporated businesses, which are more likely than unincorporated businesses to have paid employees. The share of workers who are self-employed and have incorporated businesses rose from 2.9% in 1990 to 3.7% in 2014, and the share of workers who are unincorporated fell from 8.5% in 1990 to 6.3% in 2014.
Who Is a Self-Employed Worker?
Self-employed people work for profit or fees in their own business. They could be sole proprietors of their business or own it in partnership with others. Also, the businesses run by self-employed workers may assume any of several legal forms, including incorporation. A business that is incorporated—a corporation—is an independent legal entity owned by shareholders. The corporation itself is liable for the actions of the business, not the shareholders.
Self-employed workers whose businesses are incorporated are sometimes counted as wage and salary workers because technically they are employees of their business. In this report, they are included in the count of self-employed workers.
In the Current Population Survey (CPS), workers identify themselves as self-employed in response to a question on whether they were employed by a private company, a nonprofit organization, or the government, or if they were self-employed. The final count of self-employed workers in the CPS reflects some fine tuning, such as the exclusion of people working without pay in a family business or farm.
Along with the decline in the self-employment rate, there has been a decrease in the share of the self-employed who provide jobs for others. Among unincorporated self-employed workers, 21% reported having at least one paid employee in 1995, compared with 13% in 2014. The share of the self-employed who own incorporated businesses and have paid employees is also down, from about 60% in 2001 to 41% now.5
The Pew Research Center analysis also finds that hiring by the self-employed is concentrated in the hands of a few “large” employers with a payroll of 20 or more. Of the 29.4 million jobs created by the self-employed, fully 16.3 million, or 55%, were provided by just 391,000 people. These top-tier employers—11% of all the self-employed with paid workers—each hired 42 workers, on average.
The Survey of Business Owners
An important element missing from most business statistics is information about the characteristics of business owners. Are they men or women? What is their race or ethnicity, or nativity? Are they college educated or not, and what is their age? An exception to this rule is the U.S. Census Bureau’s Survey of Business Owners (http://www.census.gov/econ/sbo/).
The Survey of Business Owners (SBO) is conducted every five years and combines data on the characteristics of business owners (gender, race and ethnicity, veteran status and nativity) with the characteristics of their businesses (number of employees, revenues, industry and location). A business is identified as male-owned if a man owns 51% or more of the stock or equity in the business, and so on. Not all businesses can be classified in a similar manner. Some are equally owned by more than person or have large, diverse ownership groups.
The latest available estimates from the SBO are preliminary estimates from the 2012 survey. Final estimates are expected to be released by December 2015 and public-use data files, necessary for deeper analysis, are expected to be made available in 2016.
The preliminary estimates for 2012 reveal a count of 27.6 million businesses, of which about 10% could not be classified by gender, ethnicity, race or another characteristic of an owner. Some 5.4 million firms (20%) had paid employees, and the total number employed in 2012 was 115.2 million. In the 2007 SBO, the majority of employment (52%) was in publicly held companies and other firms that could not be classified by owner demographics. If that share holds in the 2012 survey, employment in firms that could be classified by the characteristic of an owner would amount to 56 million workers, and the remaining 60 million or so would be in non-classifiable firms.
The SBO count of 27.6 million businesses in 2012 is much greater than the CPS count of 14.6 self-employed workers in 2014. That is because many majority owners of stock or equity in a business may not self-identify as self-employed in the CPS, especially those with ownership in incorporated businesses with a large number of employees. And, as noted, the SBO count includes publicly traded and other large firms that account for most of the total employment in the U.S.
Thus, the CPS hones in on a subset of business owners: those who identify as self-employed (“in business for themselves”) and are mostly unincorporated with few employees, on average. These are two traits the self-employed share with many entrepreneurs, and vice versa. The CPS, as a monthly survey, also provides more timely information on this group of business owners than the SBO.
Rates of Self-Employment by Demographic Groups
Owning a business, of course, is a prerequisite for creating jobs. Some 10% of workers overall are self-employed, but there are striking differences in how various demographic groups enter into self-employment.
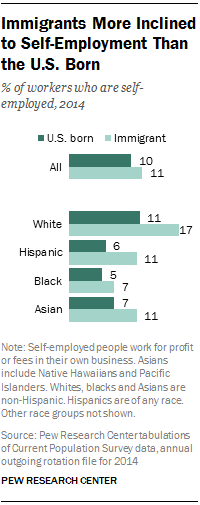
A key finding of the analysis is that immigrants are much more likely than U.S.-born workers to be self-employed. In the aggregate, the immigrant-to-U.S.-born gap in self-employment appears modest, 11% versus 10% in favor of immigrants. But marked differences emerge when the self-employment rates for immigrants and the U.S. born are considered within racial and ethnic groups.
Which Self-Employed Workers Are More Likely to Hire Paid Employees?
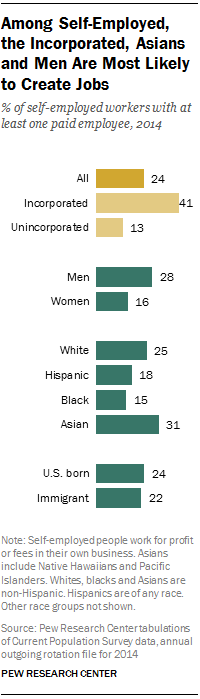
There are sharp demographic differences in the rates at which self-employed workers hire paid employees. Men not only outnumbered women among the self-employed in 2014, they were also much more likely than self-employed women to offer paid employment, by 28% to 16%. Family obligations appear to play a role in creating this disparity. In 2012, 38% of self-employed women limited their paid work to part-time for noneconomic reasons, compared with 17% of men.6 (Noneconomic factors include child care, family or personal obligations, and school or training, among others.)
Asian workers led the way in hiring among racial and ethnic groups. Nearly one-third (31%) of self-employed Asians had paid employees in 2014. That compared with 25% of self-employed whites, 18% of Hispanics and 15% of blacks. By nativity, the U.S. born were only slightly more likely than immigrants to have employees, 24% compared with 22%.
And, as noted, there is a large gap in hiring between self-employed workers in incorporated versus unincorporated businesses. Roughly four-in-ten self-employed workers (41%) with incorporated businesses had at least one paid employee in 2014, compared with 13% of those with unincorporated businesses.
Differences in the rate of hiring contribute to differences in the number of jobs created by the various groups of self-employed workers. Another factor is the average number of workers hired. Generally speaking, those who are more likely to hire are also likely to have more employees on average.
Among the self-employed with paid workers, men employed 8.8 workers on average, while women typically had 7.6. Whites, with 9.1 employees on average, led Asians, Hispanics and blacks.7 The U.S. born edged out immigrants, by 8.9 employees on average vs. 7.0. And those with incorporated businesses hired 10.2 workers on average, compared with 5.6 for the unincorporated.
Numbers of Hires by Demographic Groups
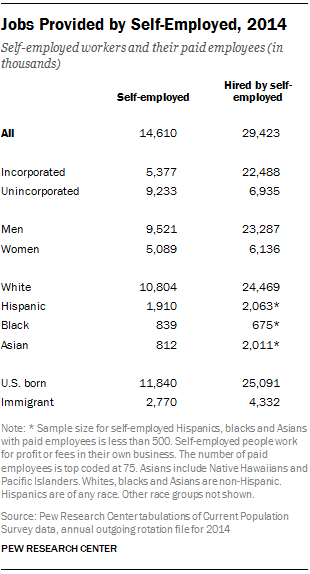
The Pew Research analysis finds that men had nearly four times as many paid employees as women did in 2014—23.3 million compared with 6.1 million, accounting for about eight-in-ten jobs (79%) provided by the self-employed. This is partly because self-employed men outnumber self-employed women by almost two-to-one, 9.5 million to 5.1 million, and partly because self-employed men are more likely to employ others.
Self-employed whites and Asians led Hispanics and blacks in job creation. In 2014, three-in-four self-employed workers (10.8 million, or 74%) were white. Self-employed whites in turn employed 24 million people, making up 83% of total hiring by the self-employed. There were 812,000 Asian self-employed workers in 2014, or 6% of all self-employed; they had 2 million paid employees, accounting for 7% of all hiring by the self-employed.
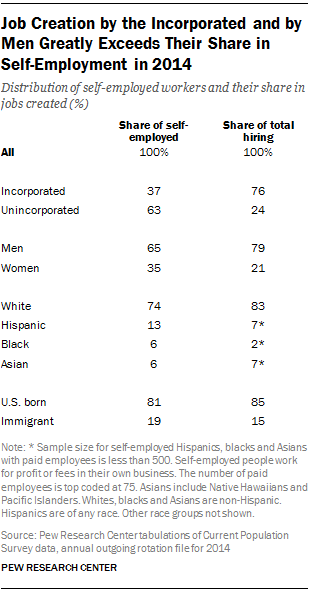
In contrast, the share of Hispanic and black self-employed in total hiring was less than their share in self-employment. The 1.9 million Hispanic self-employed accounted for 13% of all self-employment in 2014. But their 2.1 million paid employees accounted for only 7% of overall hiring by self-employed workers. Similarly, blacks were 6% of all self-employed workers, but the workers they employed represented only 2% of total hiring.
Immigrants are a significant force in self-employment and in creating jobs. There were 2.8 million self-employed immigrants in 2014 and they had a payroll of 4.3 million workers. In shares, immigrants accounted for 19% of all self-employed workers and 15% of total hiring; the U.S. born made up 81% of the self-employed and were responsible for 85% of jobs created.8
Road Map to the Report
This report focuses on job creation by the nation’s self-employed workers and looks at key differences by gender, race and ethnicity, and immigrant status.
The data required for the research became available for the first time in 2014 when it was made a part of the public version of the Current Population Survey (CPS), a monthly survey of about 55,000 households conducted jointly by the Bureau of Labor Statistics (BLS) and the Census Bureau. However, questions on the hiring of other workers were addressed to only one-quarter of the sample of self-employed workers, who are already only 10% of employed workers. To increase sample size, an annual file for 2014 was constructed from 12 monthly CPS surveys.
Despite the construction of an annual data file, it was not possible to extend the analysis to certain groups because of lingering constraints of sample size. In particular, it is not generally feasible to dive deeply into the characteristics of the self-employed who hire other workers. For example, there is insufficient sample size to characterize self-employed Hispanic or Asian immigrants who hire others. Unless otherwise noted, this study only reports estimates that are based on a sample of at least 500 workers.
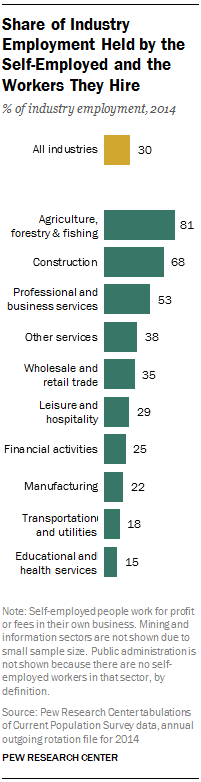
The remainder of the report is organized as follows: The next section presents estimates of self-employment rates and the overall number of jobs created by the self-employed, including how these vary by industry. Subsequent sections highlight, in turn, estimates of self-employment and job creation among men and women; racial and ethnic groups; and immigrants and the U.S. born.
Other Takes on Business Ownership
The Survey of Business Owners (SBO) and the Current Population Survey (CPS) provide two takes on business ownership, the former focusing on majority holders of business equity (27.6 million in 2012) and the latter on workers who identify themselves as self-employed (14.6 million in 2014).
Other estimates of business ownership in the U.S. are based on administrative data.
Sole Proprietorship
This count is based on Schedule C (Profit or Loss from Business) filings with the Internal Revenue Service. According to the IRS, there were 23.6 million non-farm sole proprietorships in 2012 (these are all unincorporated businesses). Almost all these businesses have zero employees (the average payroll of these businesses was less than $5,000). In the CPS, some Schedule C filers, e.g., most clergy, are explicitly excluded from the ranks of the self-employed.
Proprietors in National Income Accounts
This is a count of businesses released by the Bureau of Economic Analysis. It starts with Schedule C filings and adds “partners” based on filings of IRS Form 1065 (U.S. Return of Partnership Income). This is the highest count of business proprietors, coming in at 40.1 million in 2013. But this is not just a count of people—a business partner may be a corporation or an estate, for example.
Self-employed people work for profit or fees in their own business. They could be sole proprietors of their business or own it in partnership with others. Businesses run by self-employed workers may assume any of several legal forms, including incorporation.
All references to whites, blacks and Asians are to the non-Hispanic components of those populations. Asians include Native Hawaiians and Pacific Islanders. The terms “Asian American” and “Asians” are used interchangeably. Whites, blacks and Asians are single-race-only groups.
“U.S. born” refers to an individual who is a U.S. citizen at birth, including people born in the United States, Puerto Rico or other U.S. territories, as well as those born abroad to parents at least one of whom was a U.S. citizen. “Immigrant” refers to persons born outside of the United States, Puerto Rico or other U.S. territories to parents neither of whom was a U.S. citizen.
As a rule, this study only reports estimates that are based on a sample of at least 500 workers. Exceptions to this rule are flagged as such.