The rate of self-employment in the U.S. has held remarkably steady for the past several decades. In 2014, some 10% of American workers, 14.6 million in all, were self-employed.12 That is virtually the same as in 1976, the first year for which data on both incorporated and unincorporated self-employed workers are available, when the self-employment rate was 10.2%.13
The long-term stability in the self-employment rate conceals some variation in the interim. Speaking generally, the self-employment rate has fluctuated between 10% and 12% in the past 25 years.14 It peaked most recently in 1994, at 12.2%.
There has also been a shift in the nature of self-employment, away from the unincorporated to the incorporated. The share of workers who are self-employed and incorporated rose from 2.9% in 1990 to 3.7% in 2014, and the share of workers who are self-employed and unincorporated fell from 8.5% in 1990 to 6.3% in 2014. A major reason is the changing nature of employment in the agriculture, forestry and fishing sector. In 1990, 42.8% of all workers in this sector were unincorporated self-employed workers. By 2014, the share had fallen to 33.5%.15
Job Creation by the Self-Employed
Although trends in self-employment are well documented, evidence on hiring by self-employed workers is limited to periodic observations. Based on an analysis of data made publicly available for the first time in 2014, Pew Research Center finds that 24% of all self-employed workers—3.4 million out of 14.6 million—had at least one paid employee in 2014. Hiring was more prevalent among self-employed workers with incorporated businesses than among those with unincorporated businesses, 41% compared with 13%.
The likelihood that a self-employed worker will hire other workers has diminished over time, according to research by BLS analysts. Government surveys first asked self-employed workers whether they had at least one paid employee in 1995, addressing the question only to the unincorporated. In 1995, 20.7% of unincorporated self-employed workers reported having employees. The hiring rate among the unincorporated fell thereafter and reached 13.6% in 2009, close to its present level.
Trend data on hiring rates by self-employed workers with incorporated businesses are more limited. Existing research shows that the hiring rate by the incorporated declined from roughly 60% in 2001 to 56% in 2005.16 Pew Research Center’s estimate, which shows that 41% of self-employed workers with incorporated businesses had employees in 2014, points to an ongoing decline in the hiring rate from 2005 to 2014.
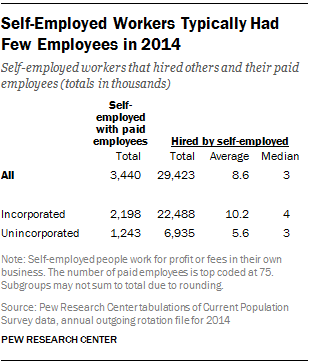
Nationally, the 3.4 million self-employed workers who hired other workers had 29.4 million paid employees in 2014. Thus, these firms had 8.6 employees each, on average, not counting the owner(s). But most businesses run by the self-employed are much smaller. At the median, self-employed workers with their own employees hired just three people—that is, half of them employed that number or fewer.
The self-employed workers who create jobs included 2.2 million with incorporated businesses and 1.2 million who were unincorporated. The incorporated, with 22.5 million jobs created, did most of the hiring. The unincorporated accounted for 6.9 million workers hired.
Among those with paid employees, the incorporated hired an average of 10.2 workers each, compared with an average of 5.6 for the unincorporated. However, the median numbers hired were similar—four for the incorporated and three for the unincorporated. Thus, in terms of employment size, most businesses run by self-employed workers, whether incorporated or not, are fairly small, with about four employees or less.
The Pew Research analysis finds that a small share of business owners with a relatively large number of employees are the drivers of job creation by the self-employed. Specifically, more than half the jobs created by self-employed workers flow from only about one-tenth of the self-employed with paid employees. Most of these businesses were incorporated.
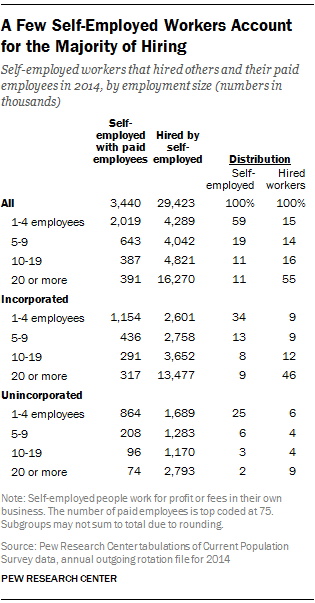
The accompanying table divides self-employed workers with paid employees into four groups: those with 1-4 employees, 5-9 employees, 10-19 employees, and 20 or more employees. There were 391,000 self-employed workers with 20 or more employees in 2014, some 317,000 of whom had incorporated their businesses. These “large” employers represented only 11% of all self-employed workers with paid employees. But they employed 16.3 million workers (of which 13.5 million were in incorporated businesses) at an average of 42 employees per firm. Moreover, the number they hired accounted for 55% of total hiring by the self-employed.
At the other end of the spectrum, some 2 million self-employed workers had only one to four employees each in 2014. These “small” employers had a total of 4.3 million paid employees in 2014, averaging about two employees per firm. Thus, 59% of self-employed workers with paid employees accounted for only 15% of total hiring.
Self-Employment and Job Creation by Industry
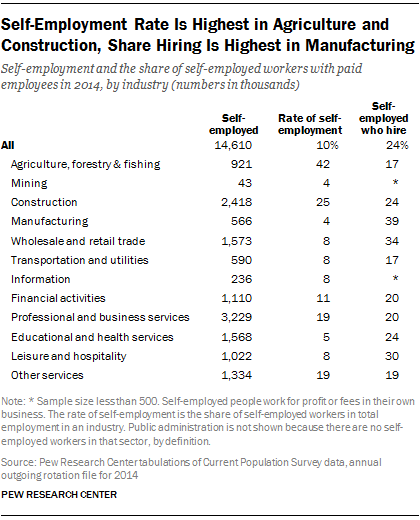
The self-employment rate varies considerably across industries. The agriculture, forestry and fishing sector had the highest rate of self-employment in 2014, with 42% of workers in that sector being self-employed. The relatively high rate of self-employment in this sector reflects a historical pattern: In 1990, 47% of workers in agriculture, forestry and fishing were self-employed.
Outside of agriculture, forestry and fishing, the 2014 self-employment rate was highest in construction (25%); professional and business services, which runs the gamut from legal to landscaping services (19%); other services, encompassing barber shops, auto repair shops and the like (19%); and financial activities, including real estate and insurance services (11%).17 The self-employment rate was in the single digits in all other industries, less than the overall rate of 10%.
A high or low self-employment rate is no predictor of the likelihood of hiring by self-employed workers in an industry. The share of self-employed workers with paid employees was highest in manufacturing (39%), wholesale and retail trade (34%), and leisure and hospitality (30%), all sectors with relatively low self-employment rates. On the other hand, only 17% of self-employed workers in agriculture, forestry and fishing had paid employees in 2014. In construction, the share with employees was 24%, the same as the national share.
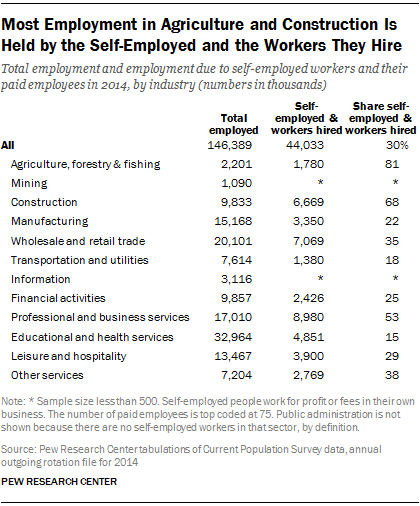
Self-employment and the jobs the self-employed extended to other workers accounted for the vast majority of total employment in the agriculture, forestry and fishing and construction sectors in 2014. In agriculture, forestry and fishing, 1.8 million of 2.2 million workers, or 81%, were either self-employed or hired by the self-employed. In construction, the self-employed and their workers accounted for 68% of total employment. The majority of employment in professional and business services (53%) was also due to self-employment in 2014.
On the other hand, job creation by self-employed workers was of lesser importance in educational and health services, transportation and utilities, and manufacturing. In these three sectors, the self-employed and the workers they hired accounted for about one-in-five or less of total industry employment.