The net worth of the nation’s households increased from 2009 to 2011, but the increase in wealth was far from widely distributed among households. The vast majority of the nation’s households experienced a decline in net worth.
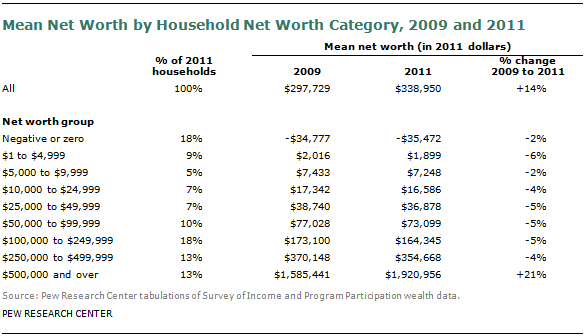
Recently released Census Bureau net worth figures indicate that mean net worth, or net worth per household, increased from $297,729 in 2009 to $338,950 in 2011, a 14% increase.
Detailed net worth figures are available for nine categories of net worth, stretching from negative or zero net worth to a net worth level of $500,000 or more. Households in all eight net worth categories from negative or zero to $250,000 to $499,999 of net worth experienced a decline in mean net worth from 2009 to 2011. Only households with a net worth of $500,000 or more experienced an increase in mean net worth, from $1,585,441 in 2009 to $1,920,956 in 2011, or 21%.
These wealth statistics do not imply that all households with a net worth below $500,000 lost wealth from 2009 to 2011. There were no doubt some gainers. But the decline in mean net worth means that the losses of the losers trumped the gains of the gainers.
In both 2009 and 2011 about 13.5% of households had a net worth of at least $500,000. However, even though the category had the same number of households in both years, some individual households moved up into the category during the period under study, and some fell out. This is true for all the wealth categories shown above.5
High Net Worth Households
Even though households with net worth of $500,000 or above saw their mean net worth increase from 2009 to 2011, this group’s median net worth decreased during the same period—to $836,033 in 2011 from $889,275 in 2009. The median refers to the midpoint of a group—in this case, households at the 93.25 percentile of wealth (halfway between the 86.5th percentile and the 100th percentile). A simultaneous rise in the mean and decline in the median implies that aggregate net worth increased only among households above the median—that is, the 8 million households with net worth of $836,033 or more in 2011. Those upper 7% of households had an estimated aggregate wealth gain of 28% from 2009 to 2011, while the estimated aggregate wealth of households in the $500,000 to $836,033 range fell by 4%.
The Changing Distribution of Household Wealth
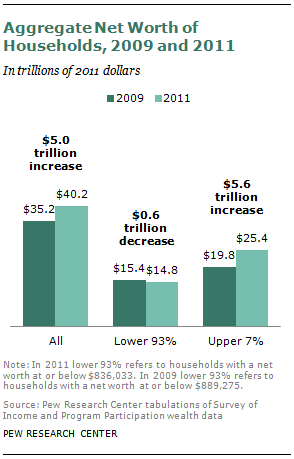
The total stock of household wealth in the U.S. increased $5.0 trillion from 2009 ($35.2 trillion) to 2011 ($40.2 trillion);6 all of these aggregate gains, and more, went to households in the upper 7%. In 2009 households with a net worth of $889,275 and below (the lower 93%) had an estimated $15.4 trillion in wealth.7 By 2011, households in the lower 93% had $14.8 trillion in wealth. Meanwhile, at the top of the wealth pyramid, the aggregate wealth of the upper 7% rose from an estimated $19.8 trillion in 2009 to $25.4 trillion in 2011 (a $5.6 trillion increase). As a result, the upper 7% of households owned 63% of the nation’s total household wealth in 2011, up from 56% in 2009.