The nation began its recovery from the Great Recession in June 2009. From mid-2009 until the end of 2011, the price or value of major classes of assets has not followed a uniform trajectory.8 Generally prices in bond and equity markets have risen significantly since the beginning of the economic recovery, while national home prices continued to decline.
Home Prices
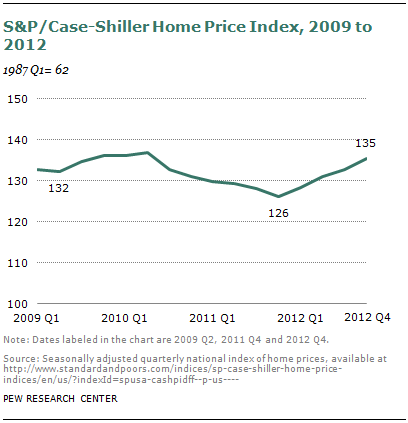
According to the S&P/Case-Shiller home price index, home prices peaked nationally in the first quarter of 2006 at 191. From the peak until the second quarter of 2009, home prices declined 31%. Though the economic recovery commenced in June 2009, hemorrhaging in the national housing market continued. Home prices fell an additional 5% from the second quarter of 2009 until the fourth quarter of 2011. National home prices bottomed out at the end of 2011; during 2012 they recovered the declines sustained since the start of the economic recovery, but they remain below the 2006 peak.
Stock Prices
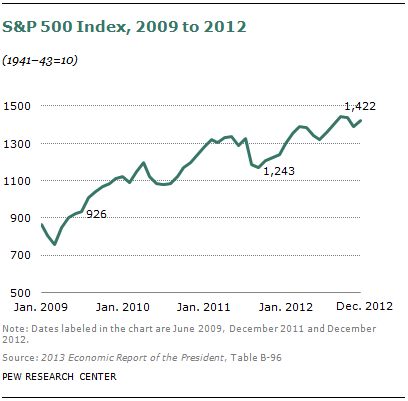
Despite some fits and starts, U.S. equity markets have generally been on an upward trajectory during the economic recovery. For example, the S&P 500 stock index reached a bottom in March 2009 (at 677 on March 9). From June 2009 until December 2011 the S&P 500 rose 317 points (from 926 to 1,243), or 34%. More recently, stocks have gone on to reach new highs. In March 2013 the S&P surpassed the prior high of 1,565 attained on Oct. 9, 2007.
Security and Bond Prices
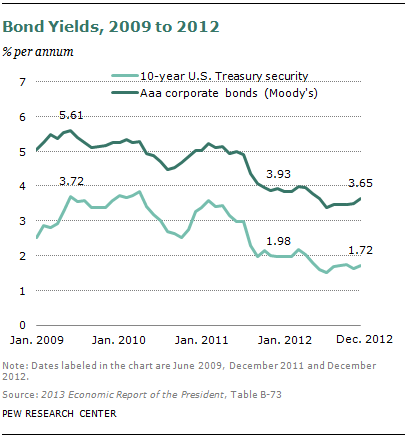
Although the particulars depend on the particular asset and term, from June 2009 until December 2011 fixed income markets performed at least as well as equity markets. As a rule of thumb, the prices of bonds move inversely with the yield or interest rate on the bond. Interest rates declined substantially from June 2009 to December 2011. For example, the yield on the 10-year U.S. Treasury security over this period fell 1.74 percentage points, or 174 basis points (from 3.72% to 1.98%). That represents a 47% decline in the rate and an equivalent gain in the price of the security. Alternatively, we can investigate rates in the corporate bond market. From June 2009 to December 2011, the Aaa corporate bond rate fell 168 basis points (from 5.61% to 3.93%), representing a 30% decline in the rate and a 30% appreciation in the value of corporate bonds. U.S. bond yields fell further over the course of 2012.