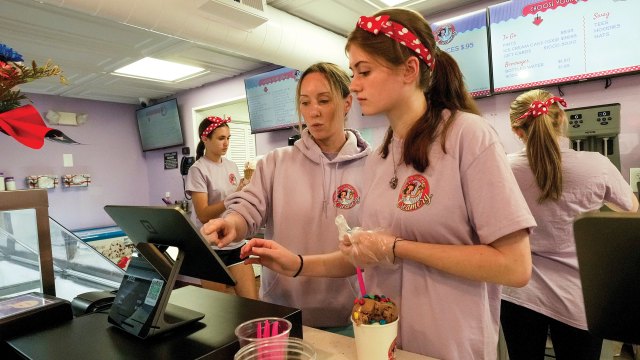
A summer job – whether scooping ice cream, busing tables or teaching campers to make lanyards – once was a rite of passage for American teens. But far fewer teens are working such jobs now than two or three decades ago.
Only 35.5% of U.S. teens ages 16 to 19 have held a paying job for at least part of summer 2026, according to a Pew Research Center analysis of federal employment data. That employment rate, which averages figures for June and July, is up a bit from last summer’s 33.8%. (Averages from 2025 and earlier include figures for August.)
As recently as 2000, more than half of 16- to 19-year-olds worked for at least part of the summer. That had been the case most summers since 1948, which is as far back as the federal jobs data goes. At the peak in 1978, 58% of teens worked for at least part of the summer.

| Year | Summer average | Rest of year average |
|---|---|---|
| 1948 | 56.5 | 44.7 |
| 1949 | 51.9 | 43.0 |
| 1950 | 53.9 | 42.7 |
| 1951 | 56.8 | 44.9 |
| 1952 | 55.9 | 43.9 |
| 1953 | 55.3 | 43.4 |
| 1954 | 49.6 | 39.8 |
| 1955 | 51.8 | 40.8 |
| 1956 | 55.1 | 42.0 |
| 1957 | 53.0 | 40.8 |
| 1958 | 47.6 | 37.2 |
| 1959 | 48.4 | 37.0 |
| 1960 | 50.4 | 37.2 |
| 1961 | 49.0 | 35.7 |
| 1962 | 50.0 | 35.8 |
| 1963 | 46.3 | 34.4 |
| 1964 | 46.5 | 34.2 |
| 1965 | 48.5 | 35.7 |
| 1966 | 53.3 | 38.3 |
| 1967 | 53.2 | 38.5 |
| 1968 | 52.9 | 38.6 |
| 1969 | 53.9 | 39.9 |
| 1970 | 51.3 | 39.3 |
| 1971 | 50.1 | 38.4 |
| 1972 | 52.8 | 40.4 |
| 1973 | 54.9 | 42.9 |
| 1974 | 54.6 | 43.2 |
| 1975 | 51.5 | 40.5 |
| 1976 | 53.1 | 41.2 |
| 1977 | 55.2 | 43.0 |
| 1978 | 58.0 | 45.1 |
| 1979 | 56.7 | 45.8 |
| 1980 | 54.5 | 44.0 |
| 1981 | 52.7 | 41.8 |
| 1982 | 49.5 | 38.9 |
| 1983 | 50.8 | 38.5 |
| 1984 | 53.2 | 40.6 |
| 1985 | 52.8 | 41.5 |
| 1986 | 53.6 | 41.7 |
| 1987 | 54.5 | 42.4 |
| 1988 | 56.7 | 43.6 |
| 1989 | 57.0 | 44.3 |
| 1990 | 53.3 | 42.7 |
| 1991 | 49.5 | 39.4 |
| 1992 | 49.0 | 38.3 |
| 1993 | 50.1 | 38.9 |
| 1994 | 51.7 | 40.6 |
| 1995 | 52.5 | 41.5 |
| 1996 | 50.8 | 41.1 |
| 1997 | 50.1 | 41.1 |
| 1998 | 52.0 | 42.8 |
| 1999 | 51.1 | 42.6 |
| 2000 | 51.7 | 43.0 |
| 2001 | 48.0 | 40.4 |
| 2002 | 45.2 | 37.7 |
| 2003 | 41.7 | 35.1 |
| 2004 | 41.6 | 34.7 |
| 2005 | 42.2 | 34.5 |
| 2006 | 42.6 | 35.1 |
| 2007 | 39.6 | 33.2 |
| 2008 | 37.4 | 31.0 |
| 2009 | 32.9 | 26.9 |
| 2010 | 29.6 | 24.7 |
| 2011 | 29.6 | 24.5 |
| 2012 | 30.5 | 24.6 |
| 2013 | 30.8 | 25.2 |
| 2014 | 31.3 | 26.1 |
| 2015 | 32.3 | 27.2 |
| 2016 | 34.0 | 28.3 |
| 2017 | 35.0 | 28.7 |
| 2018 | 34.6 | 29.2 |
| 2019 | 35.8 | 29.2 |
| 2020 | 30.8 | 27.5 |
| 2021 | 36.6 | 30.5 |
| 2022 | 37.4 | 31.3 |
| 2023 | 36.6 | 31.5 |
| 2024 | 36.0 | 30.9 |
| 2025 | 33.8 | 30.1 |
| 2026 | 35.5 | 29.1 |
But over the past quarter-century, teen summer employment has trended downward, especially after the dot-com bust and during the Great Recession. The low came during the summers of 2010 and 2011, when just 29.6% of teens – fewer than 5 million, on average – worked for pay.
During the COVID-19 pandemic in summer 2020, the teen employment rate dropped to 30.8% as many of the stores, restaurants, tourist attractions and recreational facilities that typically hire teens for summer shifts were shuttered. Teen summer employment rebounded in 2021 and 2022 as pandemic restrictions eased, but it slipped again the following three summers.
Summer 2026 was expected to be a difficult job market for teens, but the June and July data seems to show otherwise. Over those two months, an average of 6.2 million teens were working. That’s about 19,500 more than the June-July 2025 average, even though fewer teens overall have been actively seeking work this summer.

| Date for plotting | Month | 1956 | 1966 | 1976 | 1986 | 1996 | 2006 | 2016 | 2026 |
|---|---|---|---|---|---|---|---|---|---|
| 2000-01-01 | January | 40.1 | 36.0 | 38.8 | 39.1 | 39.0 | 34.0 | 27.0 | 28.2 |
| 2000-02-01 | February | 39.0 | 35.7 | 38.9 | 39.8 | 39.5 | 34.5 | 27.6 | 28.4 |
| 2000-03-01 | March | 39.1 | 35.7 | 39.9 | 41.2 | 39.8 | 34.7 | 27.9 | 29.6 |
| 2000-04-01 | April | 40.5 | 37.4 | 41.5 | 41.9 | 40.6 | 34.7 | 28.2 | 29.5 |
| 2000-05-01 | May | 42.9 | 37.8 | 43.2 | 43.5 | 43.0 | 36.0 | 29.1 | 30.0 |
| 2000-06-01 | June | 51.3 | 48.4 | 49.5 | 50.8 | 49.2 | 42.1 | 33.2 | 34.4 |
| 2000-07-01 | July | 57.7 | 56.0 | 56.6 | 56.7 | 54.0 | 44.9 | 36.1 | 36.5 |
| 2000-08-01 | August | 56.3 | 55.4 | 53.2 | 53.3 | 49.1 | 40.7 | 32.7 | – |
| 2000-09-01 | September | 45.7 | 39.5 | 41.5 | 42.4 | 42.4 | 34.5 | 28.7 | – |
| 2000-10-01 | October | 44.4 | 40.5 | 42.8 | 43.1 | 42.3 | 35.6 | 28.7 | – |
| 2000-11-01 | November | 42.6 | 40.9 | 42.0 | 42.1 | 41.4 | 35.6 | 28.5 | – |
| 2000-12-01 | December | 43.7 | 41.4 | 42.1 | 42.0 | 41.8 | 36.0 | 28.8 | – |
White teens continue to be more likely than teens of other racial and ethnic backgrounds to work in the summer, as well as during the rest of the year. So far this summer, 39% of White teens have been employed, compared with 28% of Hispanic teens, 27% of Black teens and 21% of Asian teens.

| Date | White | Hispanic | Black | Asian |
|---|---|---|---|---|
| 2025-01-01 | 32.4 | 26.3 | 21.3 | 15.1 |
| 2025-02-01 | 33.2 | 28.2 | 23.3 | 14.3 |
| 2025-03-01 | 33.6 | 28.8 | 23.4 | 19.0 |
| 2025-04-01 | 33.7 | 27.5 | 21.9 | 18.7 |
| 2025-05-01 | 33.5 | 27.5 | 23.5 | 21.3 |
| 2025-06-01 | 37.6 | 29.2 | 26.3 | 19.2 |
| 2025-07-01 | 38.8 | 29.7 | 26.9 | 22.6 |
| 2025-08-01 | 35.0 | 28.0 | 23.0 | 18.0 |
| 2025-09-01 | 32.1 | 26.8 | 25.7 | 16.3 |
| 2025-10-01 | — | — | — | — |
| 2025-11-01 | 30.9 | 25.2 | 23.9 | 22.5 |
| 2025-12-01 | 31.5 | 25.0 | 25.5 | 24.1 |
| 2026-01-01 | 30.1 | 24.8 | 24.4 | 20.0 |
| 2026-02-01 | 30.7 | 25.9 | 21.4 | 16.4 |
| 2026-03-01 | 31.9 | 27.5 | 24.5 | 16.6 |
| 2026-04-01 | 32.3 | 27.3 | 22.5 | 16.1 |
| 2026-05-01 | 33.1 | 26.5 | 22.0 | 15.9 |
| 2026-06-01 | 37.8 | 27.5 | 25.4 | 21.2 |
| 2026-07-01 | 39.7 | 29.0 | 29.1 | 20.6 |
And older teens are considerably more likely to work than younger ones. The average employment rate for 18- and 19-year-olds so far this summer is 48%, compared with 24% for 16- and 17-year-olds. (The federal government doesn’t report employment data for people younger than 16, since most of them can’t or don’t work.)
What jobs are teens working in the summer?
So far this summer, more than half of employed teens are working in two sectors of the economy. Accommodation and food services – hotels and motels, resorts, restaurants, snack shacks and the like – employed an average of 2 million teens (or 32% of all employed teens) across June and July.
And nearly 1.3 million teens are working in retail trade, representing 21% of all employed teens. If that continues in August, it will be the first increase in retail’s share of teen summer jobs since 2020, when 24% of employed teens worked in retail.

| Year | Accommodation and food services | Retail trade | Arts, entertainment and recreation | Hospitals and health services | Construction | Management, administrative and waste services |
|---|---|---|---|---|---|---|
| 2014 | 33.2 | 22.1 | 7.7 | 3.5 | 3.7 | 3.9 |
| 2015 | 34.7 | 21.7 | 8.2 | 3.8 | 3.4 | 3.8 |
| 2016 | 32.6 | 20.4 | 8.7 | 4.0 | 4.3 | 3.2 |
| 2017 | 33.6 | 22.1 | 8.4 | 4.1 | 4.3 | 3.5 |
| 2018 | 34.0 | 20.1 | 9.1 | 3.9 | 4.0 | 3.2 |
| 2019 | 32.8 | 19.2 | 9.0 | 4.7 | 4.4 | 3.7 |
| 2020 | 35.2 | 23.9 | 5.7 | 4.0 | 4.8 | 3.7 |
| 2021 | 36.6 | 22.5 | 7.1 | 4.7 | 3.9 | 3.6 |
| 2022 | 34.6 | 21.1 | 8.9 | 3.6 | 4.5 | 2.8 |
| 2023 | 35.1 | 20.8 | 7.6 | 3.6 | 5.2 | 3.0 |
| 2024 | 33.7 | 19.6 | 9.0 | 4.6 | 4.9 | 3.2 |
| 2025 | 34.1 | 19.0 | 9.5 | 4.7 | 4.0 | 3.4 |
| 2026 | 32.2 | 20.7 | 7.8 | 4.7 | 4.7 | 4.5 |
The share of teens in accommodation and food service has slipped a bit since summer 2021, when 37% of teens worked in that sector.

| Occupation | Number (in thousands) | Group |
|---|---|---|
| Food preparation and serving related | 1,529 | Food preparation and serving related |
| Sales and related | 1,104 | Sales and related |
| Transportation and material moving | 701 | Transportation and material moving |
| Office and administrative support | 449 | Office and administrative support |
| Personal care and service | 403 | Personal care and service |
| Building and grounds cleaning and maintenance | 300 | Building and grounds cleaning and maintenance |
| Construction and extraction | 258 | Construction and extraction |
| Production | 227 | Production |
| Protective service | 203 | Protective service |
| Education, training and library | 173 | Education, training and library |
| Arts, design, entertainment, sports and media | 162 | Arts, design, entertainment, sports and media |
| Healthcare support | 137 | Healthcare support |
| Installation, maintenance and repair | 130 | Installation, maintenance and repair |
| Management | 103 | Management |
| Healthcare practitioners and technical | 103 | Healthcare practitioners and technical |
| Business and financial operations | 74 | Business and financial operations |
| Farming, fishing and forestry | 59 | Farming, fishing, and forestry |
| Computer and mathematical | 29 | Computer and mathematical |
| Life, physical and social sciences | 27 | Life, physical and social sciences |
| Community and social service | 27 | Community and social service |
| Architecture and engineering | 21 | Architecture and engineering |
| Legal | 4 | Legal |
Given where most teens work in the summer, it makes sense that their two most common occupations are food preparation and serving (an average of 1.5 million teens across June and July 2026, or 25% of all employed teens) and sales (1.1 million, or 18%).
Parallelling the retail decline, the share of teens working in sales and related jobs steadily dropped between 2020 and 2025 before ticking up this summer. In summer 2020, 21% of teens worked the register.
So far this summer, more teens are working transportation and material moving jobs than in recent years: 701,000, on average, or 11% of all working teens, compared with 539,000 (9%) in summer 2025. And fewer teens are in office and administrative jobs: 449,000 (7%), compared with 563,000 (9%) in summer 2025.
Some job categories are dominated by one gender. For instance, just about all the teens working in construction and extraction jobs and in architecture and engineering occupations this summer are men. Women predominate in healthcare jobs; education, training and library jobs; and personal care and service jobs.
Why are fewer teens working summer jobs?
The long-term decline in teens working during the summer is part of a broader drop in youth employment. Economists have suggested multiple reasons teen summer employment might be declining, including:
- Job availability: There are fewer low-skill, entry-level jobs, such as sales clerks or office assistants, than in decades past.
- Teens’ availability: More schools are ending later in June and/or starting before Labor Day than in the past, and more students are taking high school or college classes over the summer.
- Other options: More teens are doing volunteer community service to fulfill graduation requirements or burnish their college applications. Some are also taking unpaid internships, which the Bureau of Labor Statistics doesn’t count as employment.