
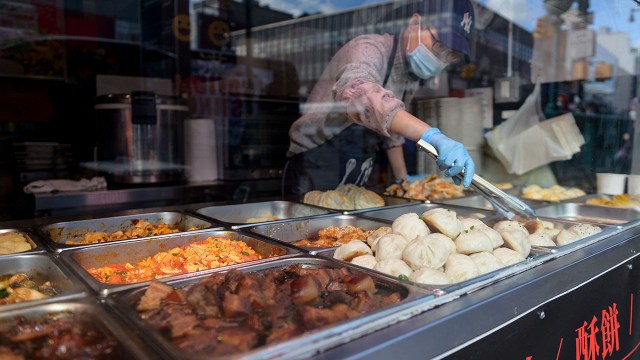
Some 12% of all restaurants in the United States serve Asian food, according to a new Pew Research Center analysis. That share is slightly higher than the 7% of the U.S. population that is Asian American.
Pew Research Center conducted this analysis to examine the geographic distribution of Asian restaurants throughout the United States and to highlight patterns of cuisines offered.
The Center purchased point-of-interest data from SafeGraph, a data company that curates high-precision data on millions of places around the globe, representing all known restaurants in the U.S. Restaurants were defined using the North American Industry Classification System (NAICS) category for “Restaurants and Other Eating Places” (NAICS code 7225). When data was collected on March 23, 2023, SafeGraph included records for 787,153 open restaurants across the U.S.
We then used SafeGraph’s category tags to identify Asian restaurants and the type(s) of food they serve. Throughout this post, we use phrases such as “Chinese restaurants,” “Chinese cuisine” and “restaurants that serve Chinese food” interchangeably.
These tags include categories for food from 10 different origin groups: Chinese, Indian, Korean, Vietnamese, Filipino, Japanese, Burmese, Pakistani, Mongolian and Thai. In addition to these groups based on specific types of Asian food, the category tags also include a general “Asian food” category. This is a broad catch-all classification that is used with restaurants that have insufficient information to place in a more specific category. Our own review of this tag found that that it may also include:
- Restaurants serving the food of smaller origin groups or groups for which SafeGraph lacks a more detailed category listing. These include Bhutanese, Taiwanese, Indonesian or Laotian restaurants, among others.
- General “pan-Asian” cuisine, either on its own or in conjunction with other types of food.
Three other category tags – “sushi,” “noodles”and “bubble tea shop” – do not explicitly reference an Asian origin group but are commonly related to Asian cuisine. Restaurants with the “sushi” tag are included in the “Japanese food” category. Restaurants with the “noodles” or “bubble tea shop” tags are included in the “Other Asian/Unspecified” category unless the restaurant is already tagged with a more specific category. Any restaurants tagged as “Italian food” or “pizza along with noodles” are not counted as Asian restaurants. These instances generally refer to the pasta noodle typical of Italian cuisine.
Individual restaurants can be included in multiple categories. For instance, a restaurant may include tags for “Japanese food” and “Thai food,” or for “Chinese food” and “Asian food.” These restaurants are counted under all categories listed. Because of this, the totals reported may exceed 100%.
Asian origin group population estimates are taken from table B02015 of the American Community Survey’s 5-year 2019 estimates, which include counties and county equivalents (such as Fairbanks North Star Borough, Alaska, for example).
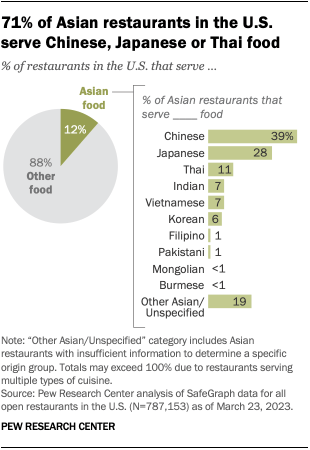
Around seven-in-ten of all Asian restaurants in the U.S. serve the food of just three Asian origin groups: Chinese, Japanese and Thai. These groups together comprise 33% of the U.S. Asian population.
Here are some other key takeaways from the analysis, which is based on data from SafeGraph, a data company that curates high-precision data on millions of places around the globe.
Chinese establishments are by far the most common type of Asian restaurant in the U.S. Nearly four-in-ten Asian restaurants (39%) serve Chinese food, which has a long history in the U.S. By comparison, Chinese Americans account for about a quarter of Asians living in the U.S. (24%).
Japanese and Thai food has spread widely, despite these groups’ relatively small shares of the U.S. population. The first sushi restaurant in the U.S. opened just over 50 years ago, but today sushi is widely available from coast to coast. Restaurants that serve Japanese food account for 28% of Asian restaurants in the U.S., making it the second-most common Asian cuisine. Japanese Americans, by comparison, are the sixth-largest Asian origin group in the country, comprising 7% of the U.S. Asian population.
Similarly, Thai establishments make up 11% of all Asian restaurants – the third-most common cuisine behind Chinese and Japanese food – while just 2% of Asian Americans are Thai. The Thai government has historically supported efforts to increase the number of Thai restaurants around the world as a form of diplomacy.
Indian and Filipino establishments account for a relatively small share of Asian restaurants. Indian and Filipino restaurants account for 7% and 1% of all Asian restaurants in the U.S., respectively – even though Indian and Filipino Americans account for nearly 40% of Asians in the U.S. combined.
Like the Asian American population, Asian restaurants in the U.S. are heavily concentrated in a few states. More than half of U.S. Asians (55%) live in five states: California, New York, Texas, New Jersey and Washington. And just under half of all Asian restaurants – 45% – are located in those five states.
More than 15% of all restaurants in Hawaii, California, Washington, Nevada and New York serve Asian food, and each state has a significant Asian American population. Meanwhile, Asian restaurants account for 6% of all restaurants in Montana, North Dakota, South Dakota and West Virginia.
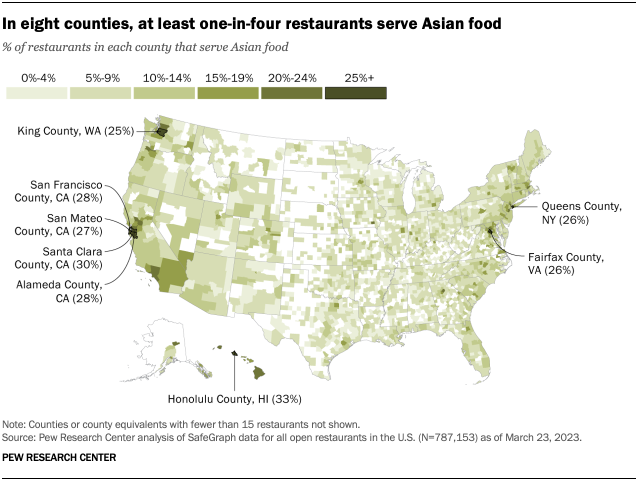
Around three-quarters of all counties in the U.S. (73%) have at least one Asian restaurant of any kind. And in eight counties with at least 15 restaurants of any type, Asian restaurants make up at least a quarter of all food establishments. Half of those counties are in California.
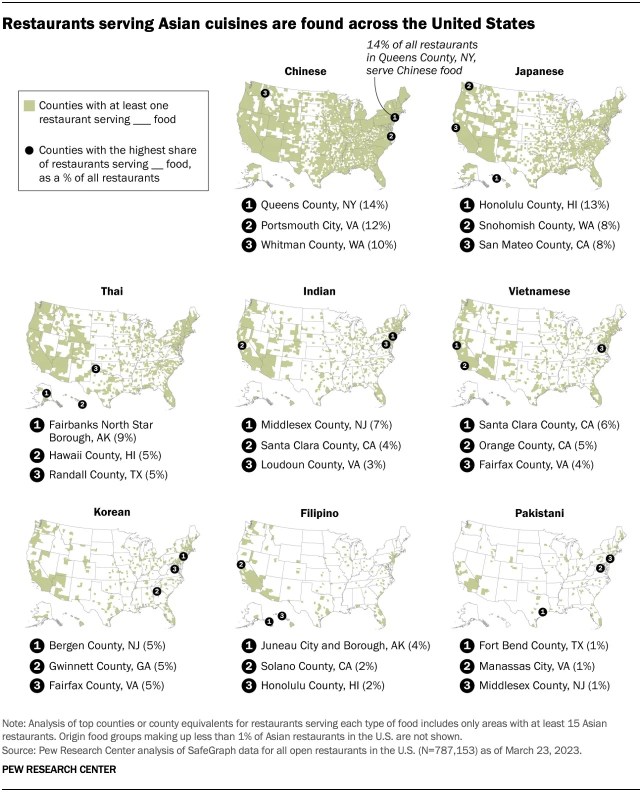
Chinese restaurants are found in every state and in 70% of all U.S. counties. Every state and a third or more of all counties also have at least one Japanese (45%) or Thai (33%) restaurant.
However, restaurants serving other types of Asian food are less widely distributed. Around one-in-five U.S. counties have Vietnamese and Indian restaurants, and fewer than 10% of counties have Filipino, Pakistani, Mongolian or Burmese restaurants.
Some 9% of Asian restaurants in the U.S. offer cuisines from multiple Asian origin groups. Nearly seven in every 10 of these establishments are combinations of Chinese or Japanese food, either with each other (36%) or with some other cuisine: 18% serve Chinese and Thai food, 15% serve Japanese and Thai food and 10% serve Japanese and Korean food.
However, these relationships are not always symmetrical. For instance, 78% of Pakistani restaurants in the U.S. also serve Indian food, but just 10% of Indian restaurants serve Pakistani food.

