Swing counties clustered in upper Midwest and on outskirts of urban areas

When it comes to presidential elections, there are fewer competitive counties, and more counties in which Democrats or Republicans hold overwhelming vote advantages, than at any time in the past three decades or so – on-the-ground evidence of the heightened partisan polarization that characterizes U.S. politics today.

Politically competitive counties have become even less common
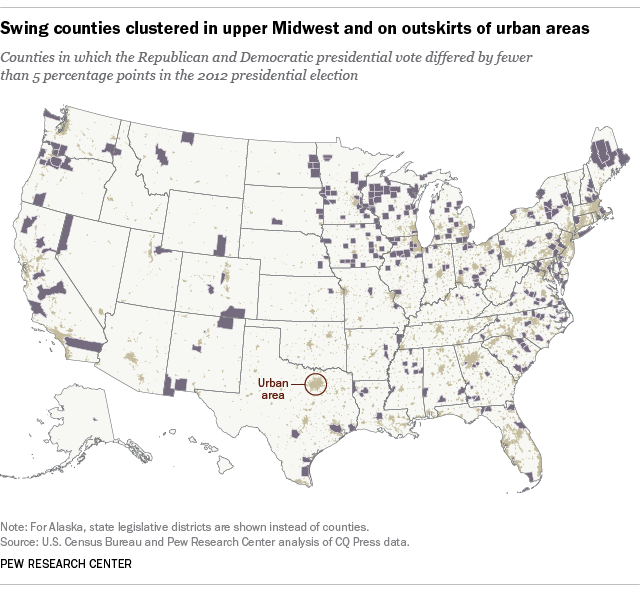
In the 2012 election, there were only 275 counties – less than 9% of all counties and county-equivalents in the nation – in which fewer than 5 percentage points separated Democrat Barack Obama and Republican Mitt Romney, according to a new Pew Research Center analysis of county-level voting data. That was the fewest closely contested counties since Ronald Reagan’s landslide re-election in 1984.

Closely contested counties aren’t, as you might expect, predominantly in the “swing states” that get the lion’s share of attention from presidential campaigns and the media covering them. While there were notable concentrations in 2012 in the upper Midwest and along the Pacific coast, closely contested counties were scattered across the country; they could be found in both strongly Democratic states (such as California and New York) and largely Republican ones (such as Texas and North Dakota). 

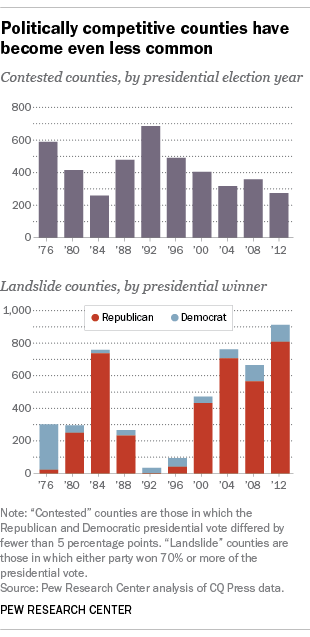
Except for a small bump up in 2008, the number of closely contested counties has been declining since 1992. At the same time, the number of counties where one party or the other holds an overwhelming partisan advantage has risen dramatically.

For example, Romney won 70% or more of the 2012 presidential vote – our threshold for a “landslide county” – in 807 counties. That was more than any other Republican had won by such a margin since at least 1976, the first year of our analysis. Meanwhile, Obama took 70% or more of the vote in 105 counties that year, the most for a Democrat since Jimmy Carter’s narrow victory in 1976.

The disparity in landslide counties might seem to give Republicans an overwhelming advantage. But the two major parties find their strongest support levels in very different places: Democrats in large urban centers, Republicans in small, rural counties. In 2012, Obama won all but 16 of the 100 most populous counties; the counties where he won at least 70% of the vote have an average population of 354,357. The counties that supported Romney at that 70%-or-more level, by contrast, have an average population of just 30,552. (The largest GOP landslide county, with just over 575,000 people, is Utah County, Utah, home to Provo and Brigham Young University.)

The growing number of counties dominated by one or the other major party reflects the clustering of Democratic- and Republican-aligned people in different places that’s been evident for some time now: As a 2014 Pew Research Center report noted, there’s a clear ideological divide both in the types of places people would like to live and where they actually live, with liberals preferring cities and conservatives favoring small towns and rural areas. Notably, Obama beat Romney rather comfortably in 2012 – winning by more than 5 million votes nationwide – while carrying only 713 (22.6%) of the nation’s 3,100-plus counties.

The most populous contested counties
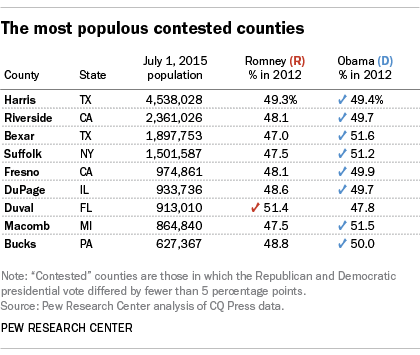
The closely contested counties range widely in population, and Texas has both the largest – Harris County (which includes Houston), with a population exceeding 4.5 million – and the smallest, Kenedy County, with just 407 residents. The most closely divided county in the nation in 2012 was Pike County, Ohio, where Romney edged out Obama by a single vote (or less than 0.009 percentage points).

For this post, we relied on county-level vote totals from CQ Press’ Voting & Elections Collection for every presidential election from 1976 through 2012, and 2015 population estimates from the Census Bureau. In 2012, votes were reported from 3,161 counties and “county equivalents” – parishes in Louisiana, legislative districts in Alaska, and independent cities in Virginia and a few other states (that total was slightly smaller in prior years). The Alaskan legislative districts were excluded from the population analyses because the relevant population data weren’t available at that level.

Topics
Economy & WorkVoters & VotingCommunismFederal GovernmentDefense & National SecurityDisasters & AccidentsInternational TechnologyRacial & Ethnic IdentityReligious Identity & AffiliationReligion & ScienceBuddhismComparison of Age GroupsDivorcePovertyTrust in ScienceEnvironmentOnline DatingGig & Sharing EconomiesOnline SearchNews CoverageData ScienceHappiness & Life SatisfactionBorder Security & EnforcementGlobal Tech & CybersecurityHuman RightsReligious Characteristics of Demographic GroupsScienceVoter DemographicsPopulismMilitary & VeteransTerrorismReligion & GovernmentImmigration AttitudesRacial & Ethnic ShiftsBeliefs & PracticesKnowledge & EducationHinduismGender & PoliticsIntermarriageWealthScience News & InformationTechnology AdoptionSocial Relations & TechInternet of ThingsE-CommerceNews Content AnalysisDemographic ResearchTime UseTechnology & ImmigrationRace, Ethnicity & PoliticsGlobal Balance of PowerNATOInternet & TechnologyVoter ParticipationNationalismNon-U.S. GovernmentsWar & International ConflictSocial Security & MedicareImmigration IssuesRacial IntermarriageInterreligious RelationsReligionsOther ReligionsEconomics, Work & GenderSame-Sex MarriageHomeownership & RentingSTEM Education & WorkforceDigital DivideStresses & Distraction OnlinePlatforms & ServicesEmailMedia PolarizationAmerican Trends PanelLifestyleGender & ReligionReligious ExtremismReligion & PoliticsUnited NationsNews Habits & MediaElection System & Voting ProcessPresidential ApprovalState & Local GovernmentNuclear WeaponsWorld LeadersIntegration & IdentityRace, Ethnicity & PoliticsReligion & Social ValuesChristianityReligiously UnaffiliatedGender Pay GapUnmarried AdultsMiddle ClassReligion & ScienceTechnology Policy IssuesUser DemographicsInternet ConnectivityBlogsElection NewsInternational Survey MethodsDeath & DyingYounger AdultsU.S. Religious DemographicsCoronavirus (COVID-19)COVID-19 & TechnologyMethodological ResearchElection NewsDonald TrumpReligion & GovernmentMilitary & VeteransWorld ElectionsImmigration & Language AdoptionRacial & Ethnic GroupsReligion & AbortionCatholicismComparison of ReligionsGender & LeadershipParenthoodFuture of WorkScience Funding & PolicyPolitics OnlineTeens & TechSocial MediaE-ReadingPresidents & PressSurvey MethodsK-12TaxesCOVID-19 & ScienceCyberattacksRural, Urban and Suburban CommunitiesOther TopicsWorld ElectionsAngela MerkelProtests & UprisingsDiscrimination & PrejudiceGlobal Image of CountriesCitizenshipBlack AmericansBiotechOrthodox ChristianityGenerationsEducation & GenderFertilityEmployee BenefitsScience IssuesDigital News LandscapeChildren & TechMobileMedia & SocietyTrust, Facts & DemocracyTelephone SurveysHigher EducationAge, Generations & TechReligious TypologyOnline SurveysUnionsPolitical IssuesPolitical Parties & PolarizationNarendra ModiParty IdentificationDrug PolicyU.S. Global ImageFamily ReunificationAsian AmericansReligion & Death PenaltyProtestantismGeneration ZGender RolesRomance & DatingUnemploymentScience KnowledgeLifestyle & Relationships OnlineOlder Adults & TechEntertainmentNews Media TrendsTrust in MediaNonprobability SurveysStudent LoansBroadbandReligious CommitmentU.S. CensusPew-Templeton Global Religious Futures ProjectU.S. Elections & VotersPolitical TypologyVladimir PutinPolitical AnimosityFree Speech & PressChina Global ImageLegal ImmigrationHispanics/LatinosReligion & LGBTQ AcceptanceEvangelicalismMillennialsMotherhood & FatherhoodFriendshipsGender & WorkGene EditingEducation & Learning OnlineRacial & Ethnic Groups OnlineMore Platforms & ServicesPolitics & MediaFacts & Fact CheckingVoter FilesElection 2004Media Layoffs & EmploymentPope FrancisEducation & Learning OnlineElection 2022ReligionElection 2020Political DiscourseMore LeadersLeadersGun PolicyOrganizations, Alliances & TreatiesRefugees & Asylum SeekersHispanic/Latino DemographicsReligious Freedom & RestrictionsPentecostalismGeneration XGender Equality & DiscriminationEconomic ConditionsGig & Sharing EconomiesClimate, Energy & EnvironmentHealthcare OnlineRural Residents & TechFacebookMedia AttitudesBots & MisinformationEducationElection 2006Religious Knowledge & EducationPope Benedict XVILeisureIsrael Global ImagePolitics & PolicyElection 2018Political & Civic EngagementBill ClintonDemographics & PoliticsHealth PolicyEuropean UnionImmigration & EconomyHispanics/Latinos & LanguageNon-Religion & SecularismMainline ProtestantismBaby BoomersSexual Misconduct & HarassmentIncome, Wealth & PovertyGovernment Spending & the DeficitFood ScienceOnline Privacy & SecurityGender & TechTwitterMisinformationAmerican News Pathways 2020 ProjectLibrariesElection 2002Educational AttainmentPope John Paul IICOVID-19 & the EconomyQualitative ResearchInternational AffairsElection 2016Politics & MediaGeorge W. BushGenerations, Age & PoliticsHealth CareBilateral RelationsHigh-Skilled ImmigrationHispanics/Latinos & EducationReligious Leaders & InstitutionsHistorically Black ProtestantismSilent GenerationLGBTQ Attitudes & ExperiencesBusiness & WorkplaceGlobal TradeHuman EnhancementNet NeutralityEmerging TechnologySmartphonesFreedom of the PressState of the News Media (Project)Personal LifeUnauthorized ImmigrationInternational Political ValuesGlobal HealthCOVID-19 in the NewsTestImmigration & MigrationElection 2014Political Ideals & SystemsBarack ObamaGender & PoliticsMigration IssuesInternational IssuesVisas & EmploymentHispanics/Latinos & IncomeReligion & GovernmentMormonismGreatest GenerationGender IdentityEconomic PolicyRemittancesMedicine & HealthOnline Harassment & BullyingFuture of the Internet (Project)AppsNews KnowledgeTelevisionPublic KnowledgeImmigration TrendsOnline Random Sample SurveysRecessions & RecoveriesSurvey BasicsPartisanship & IssuesRace & EthnicityElection 2012DemocracyGovernmentEducation & PoliticsLGBTQ AcceptanceEnvironment & ClimateRemittancesHispanic/Latino IdentityReligion & PoliticsJudaismComparison of GenerationsSame-Sex MarriageEconomic SystemsStudent LoansSpaceMisinformation OnlineArtificial IntelligenceTextingMedia IndustryNewspapersOccupational GroupsCOVID-19 & PoliticsScientists' ViewsGovernment Spending & the DeficitResearch ExplainersPolitical PolarizationAge & GenerationsElection 2010AuthoritarianismTrust in GovernmentIssue PrioritiesNational ConditionsGlobal Economy & TradeRacial Bias & DiscriminationHispanic/Latino VotersInternational Religious Freedom & RestrictionsIslamAgeHousehold Structure & Family RolesPersonal FinancesRetirementVaccinesTech CompaniesAlgorithmsVideoNews Platforms & SourcesAudio, Radio & PodcastsMilitary & VeteransAtheism & AgnosticismJournalistsUnemploymentInstagramU.S. DemocracyGender & LGBTQElection 2008CapitalismSupreme CourtAbortionPrivacy RightsInternational TerrorismSegregationWhitesReligious DemographicsMuslim AmericansTeens & YouthFamily CaregivingIncome & WagesBirth Rate & FertilityClimate ChangeOnline ActivismAutomationGamingDigital News LandscapeNews Audience DemographicsPoliceJoe BidenPoliceReligion & BioethicsEvolutionPolitical PartiesFamily & RelationshipsElections Before 2008SocialismCongressDeath PenaltyCriminal JusticeNuclear WeaponsRace RelationsMore Racial & Ethnic GroupsGlobal Religious DemographicsMuslims Around the WorldOlder Adults & AgingMarriage & DivorceEconomic InequalityGenderEnergyCivic Activities OnlineBotsMusicLocal NewsSocial Media & the NewsJournalistsImmigrant PopulationsWar & International ConflictYouTubeSize & Demographic Characteristics of Religious Groups
Drew DeSilver  is a senior writer at Pew Research Center.