

Liberals and conservatives are divided over more than just politics. Those on the opposite ends of the ideological spectrum disagree about everything from the type of community in which they prefer to live to the type of people they would welcome into their families.
It is an enduring stereotype – conservatives prefer suburban McMansions while liberals like urban enclaves – but one that is grounded in reality. Given the choice, three-quarters (75%) of consistent conservatives say they would opt to live in a community where “the houses are larger and farther apart, but schools, stores and restaurants are several miles away,” and just 22% say they’d choose to live where “the houses are smaller and closer to each other, but schools, stores and restaurants are within walking distance.” The preferences of consistent liberals are almost the exact inverse, with 77% preferring the smaller house closer to amenities, and just 21% opting for more square footage farther away.
Americans overall are divided almost evenly in this preference, with 49% preferring the larger houses and 48% preferring the more convenient locations.
Liberals and conservatives don’t disagree on all community preferences. For example, large majorities of both groups attach great importance to living near family and high-quality public schools.
Yet their differences are striking: liberals would rather live in cities, while conservatives prefer rural areas and small towns; liberals are more likely to say racial and ethnic diversity is important in a community; conservatives emphasize shared religious faith. And while 73% of consistent liberals say it’s important to them to live near art museums and theaters, just 23% of consistent conservatives agree – one of their lowest priorities of eight community characteristics tested.
This section explores these and other key ways in which political polarization is linked to people’s personal lives and day-to-day interactions. As Republicans and Democrats are growing further apart, increasingly polarized along ideological lines and with greater antipathy toward the opposing party, divides in the political sphere also permeate the everyday lives of Americans.
Consistent conservatives and liberals do share one habit that distinguishes them from other Americans: They spend a lot of time talking about politics and government. This is part of a pattern of more intense political engagement among those at either end of the ideological spectrum.
Yet conservatives and liberals also are most likely to confine political conversations to those who share their views. Fully half of consistent conservatives (50%) and 35% of consistent liberals say it is important to them to live in a place where most people share their political views – the highest shares of any of the ideological groups. If people living in “deep red” or “deep blue” America feel like they inhabit distinctly different worlds, it is in part because they seek out different types of communities, both geographic and social.

The Ideal Community: Different for Liberals than for Conservatives
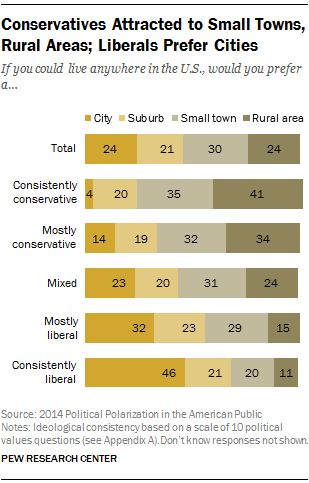
When it comes to the type of community they’d like to live in, liberals are drawn toward city life while conservatives prefer small towns and rural areas. Given the choice to live anywhere in the U.S., 41% of consistent conservatives would want to live in a rural area, and an additional 35% would choose a small town. Fewer consistent conservatives (20%) would prefer living in the suburbs and just 4% want to live in a city.
In a near mirror image, 46% of consistent liberals would choose to live in a city, and 21% would choose the suburbs; far fewer would pick a rural area (11%) or a small town (20%).
The preferences of less ideological Americans are more varied. Notably, the suburbs do not have a great deal of appeal for any ideological segment. And across age, gender and other demographic categories, there is no group that expresses a clear preference for living in the suburbs.
An analysis of the data finds that where liberals and conservatives actually live reflects their community preferences, with liberals about twice as likely as conservatives to live in urban areas, while conservatives are more concentrated in rural areas.
Later reports in this Pew Research Center series will dive more deeply into how political views are related to where people live. This is a topic covered extensively by Craig Gilbert of the Milwaukee Journal Sentinel, in a four-part series entitled “Dividing Lines.”
What’s Important in a Community?

Despite their differing community preferences, liberals and conservatives generally share a desire to be close to family, good schools and the outdoors. However, when it comes to the ethnic, religious or political makeup of a community, there are clear ideological divides.
Substantial majorities across all ideological groups place importance on living near extended family, though consistent liberals are a bit less likely than others to say this.
Likewise, large majorities say “high-quality public schools” are important to decisions about where to live. Reflecting their stage of life, people age 55 and older are less likely than younger people to value good schools. To control for this lifecycle difference (and because older Americans tend to be more conservative ideologically), the analysis here is based only on those under 55.
Within this cohort, an emphasis on high-quality schools is slightly lower among conservatives than liberals. But across all ideological groups, this ranks as the top community priority of the eight items tested.
Having access to the outdoors for hiking, camping and fishing also is a widely valued community attribute. However, there is an ideological split in the importance placed on access to another type of leisure activity: art museums and theaters. More than three times as many consistent liberals (73%) as consistent conservatives (23%) rate proximity to museums and galleries as important. There also is a wide gap among people with mostly liberal (59%) and mostly conservative (31%) views.

There are similarly deep ideological divides in the importance placed on racial and ethnic diversity and living near those who share one’s religious faith. Majorities of consistent liberals (76%) and those who are mostly liberal (58%) say living somewhere with a mix of people from different racial and ethnic backgrounds would be important to them; far fewer conservatives (20% of consistent conservatives, 32% of mostly conservatives) say this. (This ideological pattern is nearly identical when the analysis is limited to non-Hispanic whites.)
At the same time, conservatives place more importance on living in a place where many people share their religious faith. A majority (57%) of consistent conservatives say this is important to them, compared with just 17% of consistent liberals.
Marrying Across Party Lines
While Republicans and Democrats hold increasingly negative views of the opposing party, expressions of deep dislike on a more personal level are less common. But they do exist, and as with dislike of the opposing party, personal antipathy is most concentrated among those who hold ideologically consistent views.
Most Americans are comfortable with political diversity in their households. Just 9% of the public say they would be unhappy if an immediate family member were to marry a Republican, and about the same percentage (8%) would be unhappy about the prospect of a Democrat marrying into their immediate family. Roughly equal percentages of Democrats (15%) and Republicans (17%) say they would be unhappy welcoming someone from the other party into their family.

This discomfort is most prevalent among those who are the most ideological in their thinking. Three-in-ten (30%) consistent conservatives say they’d be unhappy if a family member married a Democrat, while 23% of consistent liberals say they’d be unhappy if a Republican were to marry into the family. Yet even at the ends of the ideological spectrum, active expressions of unhappiness about marrying a Republican or a Democrat are the minority position.
Beyond the partisan affiliations of potential family members, the importance of other characteristics also differs for liberals and conservatives. Roughly half of Americans (49%) say they would be unhappy if a family member were to marry someone who doesn’t believe in God.
This rises to 73% among consistent conservatives, along with 58% of those who are mostly conservative. Liberals are much less likely to be unhappy with a non-believer marrying into their families: 24% of consistent liberals and 41% of those who are mostly liberal say they would be unhappy.

Only 9% of Americans say they would be unhappy with a family member’s marriage to a born-again Christian. But this sentiment triples to 27% among consistent liberals. Consistent liberals are as likely to say they’d be unhappy with a family member’s marriage to a non-believer (24%) as a born-again Christian (27%).
Just 11% of Americans say they would be unhappy at the prospect of a family member marrying someone of a different race, and only 7% say the same about a marriage to someone born and raised outside of the U.S. But both of these sentiments are more common on the right than on the left.

About a quarter (23%) of consistent conservatives, along with 19% of those who are mostly conservative, say they’d be unhappy with a family member’s marriage to someone of a different race. Most conservatives (77%) say it wouldn’t matter or they would be happy about this. By comparison, just 1% of consistent liberals and 4% of those who are mostly liberal say they would be unhappy if a relative marries someone of a different race.
Reaction to a gun owner joining the family exposes a somewhat greater ideological divide. Nationwide, 19% of Americans say they would be unhappy if someone in their immediate family married a gun owner, while 17% say they would be happy (most say it wouldn’t matter to them).
Most consistent liberals agree that it wouldn’t matter to them, but 31% say it would make them unhappy if someone in their immediate family married a gun owner while just 5% would be happy about it. Gun ownership draws far greater enthusiasm among consistent conservatives, 49% of whom would be happy to welcome a new gun-owning family member, and just 1% would be unhappy about it. For more on gun policy views, see Section 4.
While the divides over whether a prospective in-law hasn’t attended college are comparatively small, liberals are somewhat likelier than conservatives to say they’d be unhappy with this (17% of consistent liberals would be unhappy, compared with 8% of consistent conservatives).
Consistent Liberals, Conservatives Talk Politics More Often

Most Americans don’t talk about politics all that frequently: 58% of the public discusses government and politics a few times a month or less, while 42% discuss politics more often.
On average, Republicans talk about politics more frequently than Democrats (49% vs. 39% talk a few times a week or more), but discussions about politics are considerably more common among those with ideologically consistent views, on both the left and the right.
About seven-in-ten (69%) consistent conservatives and six-in-ten (59%) consistent liberals talk about politics a few times a week or more; that compares with just 32% of those who are ideologically mixed. And while those who are mostly liberal in their views are no more likely to talk about politics than the ideologically mixed (just 34% do so at least a few times a week), those with mostly conservative positions are (48%).
The Ideological Echo Chamber

Not only do people who are ideologically consistent talk about politics more frequently than others, but they are also more likely to say their friends share their political views. This is particularly the case among consistent conservatives.
Just 35% of Americans say “most of my close friends share my views on government and politics,” while about as many (39%) say “some of my friends share my views, but many do not.” About a quarter (26%) say: “I don’t really know what most of my close friends think about government and politics.”
But among consistent conservatives, roughly twice as many say most of their close friends share their views as say many of their friends do not (63% vs. 30%). And among the mostly conservative, more also say their friends share their views (44% vs. 36%).
Though consistent liberals are less likely than consistent conservatives to say most of their close friends share their political views, this is still the plurality opinion among this group: 49% say most of their friends share their views, while 39% say many of their friends do not share their views. Among both those who are ideologically mixed and those who are mostly liberal, just a quarter (25%) say most of their friends share their political views.
Dislike the Party, Avoid the People
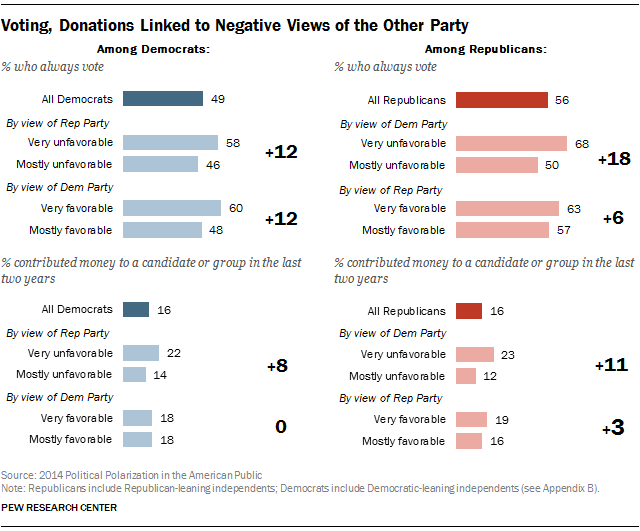
These indicators suggest that there is a tendency on the left and the right to associate primarily with like-minded people, to the point of actively avoiding those who disagree. Not surprisingly, this tendency is also tightly entwined with the growing level of partisan antipathy. In both political parties, those with strongly negative views of the other side are more likely to be those who seek out compatible viewpoints.
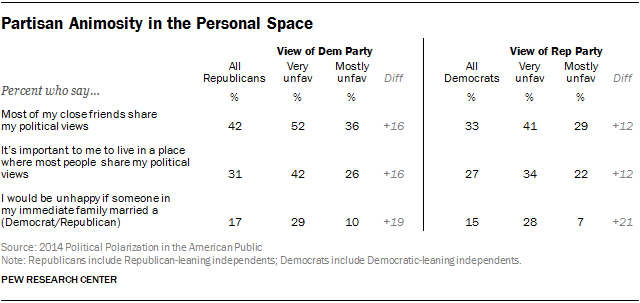
Roughly half (52%) of Republicans with a very unfavorable view of the Democratic Party say most of their friends share their political views, compared with 36% of Republicans with less antipathy for the Democratic Party. And the same pattern exists among Democrats. The more polarized Republicans and Democrats are also substantially more likely to say they prefer living in a community where most people share their political views.
Not only do many of these polarized partisans gravitate toward like-minded people, but a significant share express a fairly strong aversion to people who disagree with them. Overall, 17% of Republicans say they would be unhappy if someone in their immediate family married a Democrat. But that aversion is three-times higher among Republicans who view the Democratic Party very negatively (29%) than among those with less negative views (10%).
Similarly, Democrats with a very unfavorable view of the Republican Party are four times as likely as those with a mostly unfavorable view to say they would be unhappy if someone in their family married a Republican (28% vs. 7%).
Polarized Views of Cable News
Public perceptions of two major news sources – MSNBC and the Fox News Channel (FNC) – are deeply divided along ideological lines. And what stands apart the most are the negative views among those on the other side of the ideological spectrum.
Notably, both of these news channels are viewed more favorably than unfavorably in the public at large, reflecting the fact that both receive generally favorable, or at least neutral, marks from people with mixed ideological views. In that regard, while consistent conservatives overwhelmingly express a positive view of the Fox News Channel (74% favorable), that is a more uniform expression of the generally favorable view found among the general public. By contrast, the strongly negative reaction to Fox News from consistent liberals – fully 73% view FNC unfavorably and just 8% favorably – stands starkly apart.

The same pattern arises in views of MSNBC. Consistent conservatives are far-and-away the most likely to have an opinion of MSNBC, and it is overwhelmingly negative: 71% unfavorable and just 10% favorable. This stands in contrast to the positive balance of opinion from the public at large.
One thing that differs when it comes to MSNBC is that it does not draw the same uniformly positive reviews from consistent liberals that FNC does from consistent conservatives. While nearly half (45%) of consistent liberals view MSNBC favorably, that’s not much better than how MSNBC rates among those with mixed ideological views (38%). Nearly half of consistent liberals offer no opinion of MSNBC. By contrast, the vast majority of consistent conservatives offer an opinion of Fox News, with 74% favorable and just 5% unfavorable.
The Pew Research Center will dive much more deeply into the topic of media sources and polarization in a report later this year, exploring the relationship between actual media use and political polarization.
