
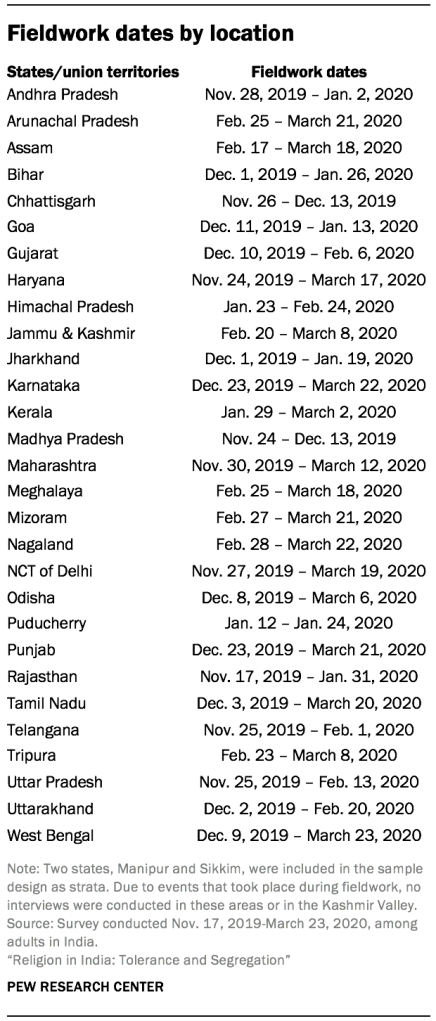
Between Nov. 17, 2019, and March 23, 2020, Pew Research Center completed 29,999 face-to-face interviews with non-institutionalized adults ages 18 and older living in 26 states and three union territories across India. The sample includes interviews with 22,975 Hindus, 3,336 Muslims, 1,782 Sikhs, 1,011 Christians, 719 Buddhists and 109 Jains. An additional 67 respondents belong to other religions or are religiously unaffiliated. Six groups were targeted for oversampling as part of the survey design: Muslims, Christians, Sikhs, Buddhists, Jains and those living in the Northeast region.
Interviews were conducted under the direction of RTI International. Data collection used computer-assisted personal interviews (CAPI) after random selection of households. Sampling was conducted through a probability-based, stratified multistage clustered random design that used composite measures of size (cMOS) to increase diversity in religious representation. National population and religious composition data are available from the 2011 census of India.
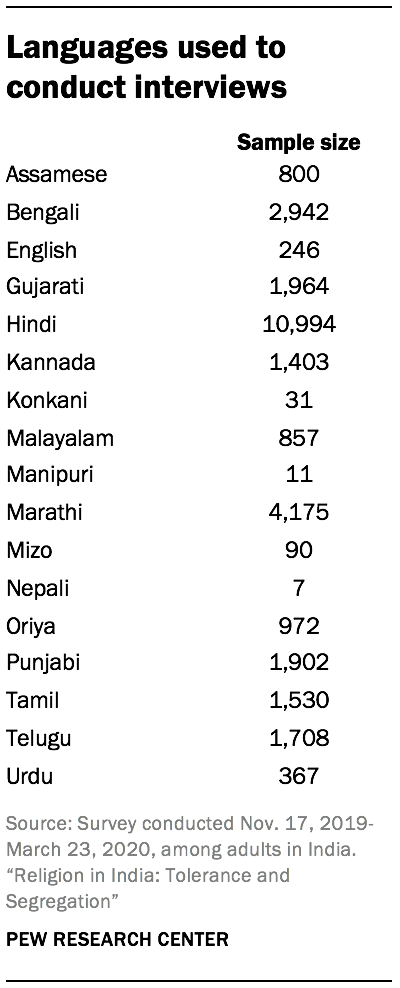
The questionnaire was designed by Pew Research Center staff in consultation with subject-matter experts and advisers to the project. The questionnaire was developed in English and translated into 16 languages, independently verified by professional linguists with native proficiency in regional dialects, and pretested in various phases prior to fieldwork.
Throughout fieldwork, survey performance was assessed by comparing regional results for key demographic variables (including reported religion) with region-specific population statistics available through the census. Data are weighted to account for different probabilities of selection among respondents as well as through an iterative procedure to more closely align the samples with official state and national population figures for gender, age, urbanicity, region and education. The reported margins of sampling error and the statistical tests of significance used in the analysis account for the design effects due to weighting and sample design.
Questionnaire design
The questionnaire covers multiple topics, including religious identity, belief and practice; social cohesion, national identity and politics; gender and the family; and demographic characteristics.24 To improve respondent comprehension of survey questions and to ensure all questions were culturally appropriate, Pew Research Center followed a multiphase questionnaire development process that included focus groups, cognitive interviews, a pretest and a pilot survey before the national survey. An in-country institutional review board (IRB) also approved the questionnaire, including the consent language, to protect the rights and privacy of Indian respondents.
The question wording and approach to various topics were refined between each phase of the research process. Throughout questionnaire development, academic experts and other advisers were consulted to further improve the questionnaire.
Twenty-two focus groups were conducted to explore and identify key topics related to religion, diversity, nationalism and gender. Focus groups were conducted under the direction of Ipsos MORI and Quipper Research. They were held in five states – Arunachal Pradesh, Gujarat, Maharashtra, Tamil Nadu and Uttar Pradesh.
Fifty-six cognitive interviews were conducted to test survey questions for general comprehension, problematic phrasing or concepts, and to pinpoint sensitivity concerns. Cognitive interviews were conducted under the direction of Ipsos MORI. They were held in 10 states – Andhra Pradesh, Assam, Gujarat, Karnataka, Kerala, Maharashtra, Odisha, Rajasthan, Tamil Nadu and West Bengal.
The fully translated and independently verified questionnaire was then pretested (n=100) across all 16 local languages used in the final survey. The pretest was conducted in six states and union territories – Andhra Pradesh, Assam, Delhi, Maharashtra, Tamil Nadu and West Bengal.
Finally, a pilot survey (n=2,045) was administered to test all survey processes, including interviewer training, questionnaire sensitivity and data quality checks. Pilot survey states were Karnataka, Tamil Nadu, Uttar Pradesh and West Bengal.
In addition to a CAPI instrument, the questionnaire included two show cards. One show card displayed 23 political party symbols and was used to administer questions on party preference and voting behavior. The other show card displayed 15 images of gods and goddesses and was used to administer the question on ishta devata (personal deities). For all questions that used a show card, respondents could select a political party or deity by either selecting an image or saying the associated name.
Sample design and weighting
The survey sample was designed to be nationally representative of the Indian population and was selected using a stratified, multistage cluster method. The sample is also designed to allow for robust analysis of all major religious groups – Hindus, Muslims, Christians, Sikhs, Buddhists and Jains – as well as all major regional zones.25 To bolster representation of religious groups with lower prevalence in the country, the sample design uses a composite measure of size (cMOS) to increase the probability of selecting primary and secondary sampling units with those religious populations. To ensure adequate sample for stand-alone analyses of the Northeast, the least populated of the zones, the region’s strata are allocated more sample than proportional to population size.
Sample design
Strata design begins with states and union territories (UTs) as defined by the 2011 census. The smallest groups are then collapsed together, resulting in a total of 30 strata covering 33 states and UTs as defined by the 2011 census.26 All sampling units have official statuses and known boundaries defined by the 2011 census. The primary sampling units (PSUs) are clusters of districts, grouped to have approximately 10 or more secondary sampling units (SSUs); the SSUs are primarily subdistricts but also include some large metropolitan areas; and the tertiary sampling units (TSUs) are 2011 census enumeration blocks (CEBs) in urban areas and villages in rural areas. The number of PSUs sampled per stratum is proportional to the composite measure of size for a total of 138 PSUs. Six SSUs are sampled from each PSU and four TSUs are sampled from each SSU, with some exceptions. The sample draw for the national study was conducted in June 2019, five months prior to the start of fieldwork.
Twelve households within each TSU are selected via a random-route procedure – a process in which field staff count residential dwellings from a random starting point as they walk the street and select every nth dwelling for an interview, where n is adjusted for the size of the area for random route. Within a household, interviewers list all adults (18+ years) and the CAPI device selects one adult at random for the interview. At every address, up to four visits to the household are made to complete an interview. Attempts to contact selected households and respondents are carried out on different days of the week and times of day (with a few exceptions where security and remoteness call for a one-day approach).
Composite measure of size (cMOS)
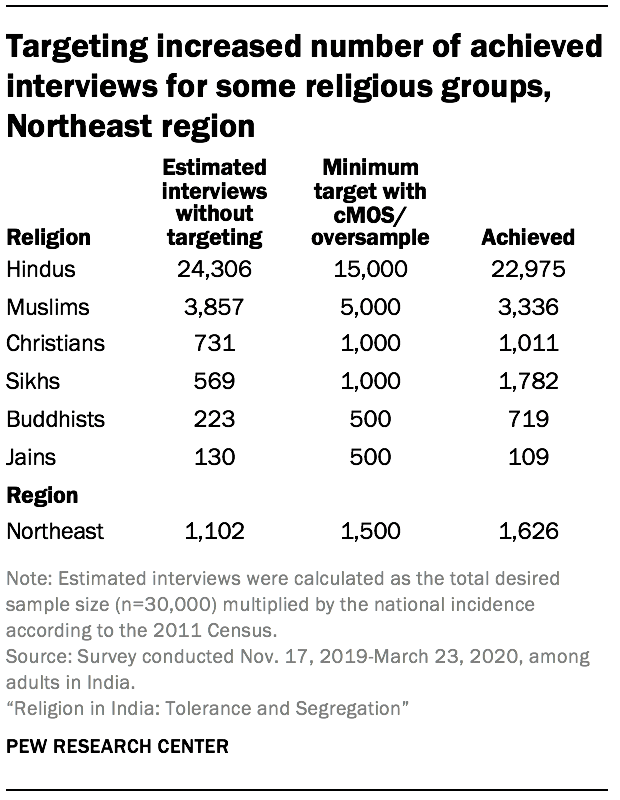
If the sample had been selected using a typical approach for general population surveys (e.g., probability proportional to population size), there likely would not have been enough respondents from some religious groups of interest for separate analysis and reporting. Instead, the design sought to increase the chance of selecting less-prevalent religious groups by using a cMOS for sampling PSUs and SSUs. Constructed using the 2011 census data on religious compositions of districts and subdistricts, the cMOS calculations assign more value to PSUs and SSUs with greater shares of Muslims, Christians, Sikhs, Buddhists or Jains relative to the national figures. PSUs and SSUs are both selected using a systematic probability proportional to composite size method, resulting in areas with low-incidence religious populations having greater chances of selection. For example, Mansahi and Sameli, two subdistricts in the eastern state of Bihar, have approximately the same population size (84,257 and 84,486, respectively), but Mansahi’s population as of the 2011 census was 44% Muslim while Sameli’s was 9% Muslim. In a general population design, these two subdistricts would have about equal chances of selection. But in this study, Mansahi has a greater chance using our cMOS, since Mansahi is home to a large share of a lower-incidence religious group. The cMOS method improved the odds of a religiously diverse sample but did not guarantee it, as demonstrated by the shortfall that remains for Muslims and Jains. Prior to systematic selection, the frame is sorted geographically to help disperse the sample within strata and sampling units.
No religious composition data is available at the TSU level, so TSUs are selected with probability proportional to their population size. A systematic selection approach and implicit stratification by urbanicity are used to help diversify the sample to cover both urban and rural areas.
Weighting
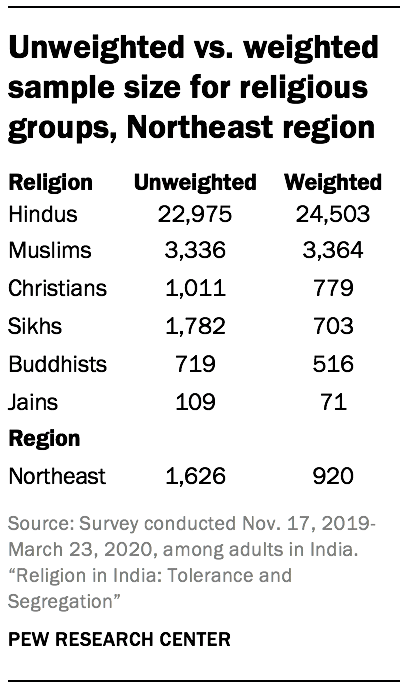
The data are weighted in a multistep process. As a result of using the cMOS, the unweighted sample has more respondents belonging to certain religious groups than would normally occur in a nationally representative sample. Varying probabilities of selection are addressed through statistical adjustments, or weighting, and areas with higher sampling rates are represented in proper proportion to areas with lower sampling rates.
Weights are also adjusted in an iterative proportional fitting poststratification process, commonly referred to as raking, so that the weighted sample distribution more closely aligns with 2011 census population figures. This calibration process is conducted for age by gender, education and urbanicity separately for each of the 28 strata where fieldwork was completed and using stratum-specific population parameters.
The weights for each stratum are then scaled to correct for the oversampling of some regions and states and the corresponding undersampling of larger regions and states. This ensures that all states and subsequent regions are represented in their proper proportion in the weighted estimates included in this report. Finally, the distribution of the raked weights is examined separately for each regional zone, and customized weight trimming (i.e., setting weight ceiling and floor figures) is performed at the zonal level to prevent individual interviews from having too much influence on the final results.
In the end, the oversampled religious groups and the higher number of respondents in the Northeast do not represent a disproportionate share of the final, weighted sample that is used for analysis.
Coverage and exclusions
Survey coverage is calculated to be 98% of the Indian population. Exclusions, listed below, amounted to about 2% of the national population of India.
Exclusions known prior to sampling:
- Union territories of Andaman & Nicobar Islands and Lakshadweep due to remoteness
- Subdistricts that posed a security risk to field staff
- Subdistricts with no reliable population figures from the 2011 census
- Ministry of Defense military cantonment board areas due to inaccessibility
- TSUs with fewer than 25 households due to remoteness.
Exclusions after sampling (see “Significant events during fieldwork” below for more information):
- Kashmir districts due to continued shutdown of the Kashmir Valley during fieldwork
- Sikkim and Manipur states due to COVID-19.
Precision of estimates
Each item in a survey has its own margin of sampling error (MOSE). The multistage sampling process used in this survey – districts or district groups, subdistricts, villages or census enumeration blocks, households, and eligible individuals within households – means that survey responses are not independent of each other as they would be if we had taken a simple random sample of the Indian population. This clustering of respondents has the effect of increasing the MOSE estimates relative to a simple random sample of the same size. Additionally, this clustering means that every question has a different margin of error depending on how similar respondents in the same village or region are to one another for the item in question. Some estimates (e.g., self-identification as a vegetarian) have a relatively small MOSE, while other estimates (e.g., knowledge of other religions’ practices) have a larger margin of error.
In addition to clustering, the MOSE is affected by stratified sampling and weighting. Analyses to determine statistical significance for this report were performed using Stata statistical software that accounts for all of these complex design features for tests of statistical significance and measures of sampling error.
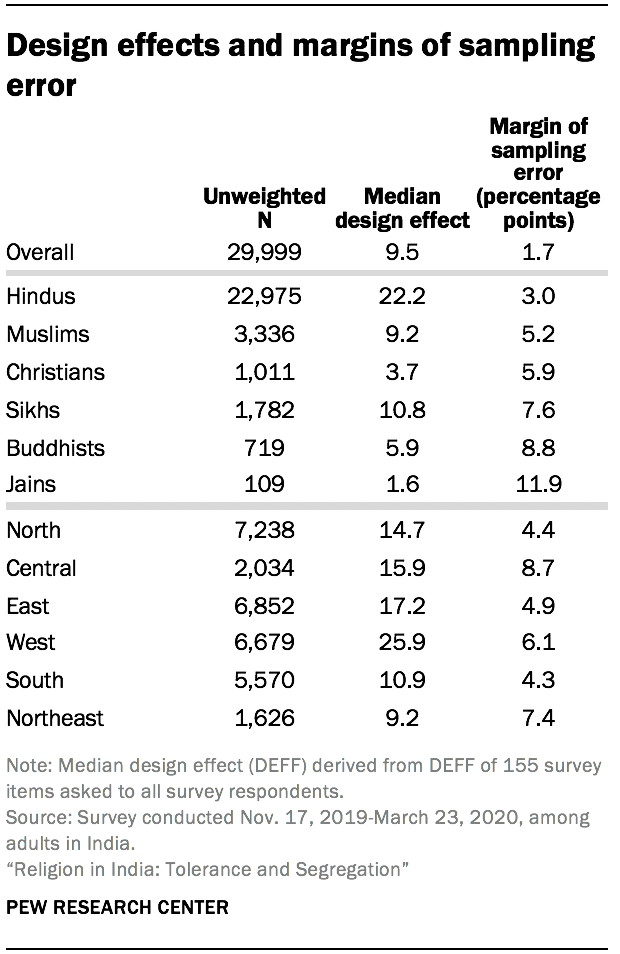
We have reported the median MOSE as a rule of thumb when assessing significant differences. In order to reach one MOSE overall and for each subgroup, a median MOSE is produced from 155 individual ones. One should also bear in mind that question wording and practical difficulties in conducting surveys can introduce error or bias into survey results that is not captured by the MOSE.
For results, one can say with 95% confidence that the error attributable to collecting data from some, rather than all, adults within the population is plus or minus the MOSE. This means that in 95 out of 100 samples of the same size and type, the results obtained would vary by no more than plus or minus the MOSE for the population in question.
Response rates

The contact rate for the survey was around 97% for the country overall and for both urban and rural areas.27 Most regions had a contact rate around 97%, except for the Central region, which had a contact rate of 90%.
The overall cooperation rate for this project was 89%, and the cooperation rates were roughly the same for urban and rural areas.28 The cooperation rates range from 83% in the South to 93% in the West.
The overall response rate for this survey is 86%.29 The response rates vary somewhat by region and urbanicity but are generally between 80% and 90%.
Significant events during fieldwork
During the fieldwork period between November 2019 and March 2020, fieldwork teams dealt with a number of events that posed challenges to entering certain areas of study and securing interviews with selected households and respondents.
Due to access and safety concerns, planned fieldwork in Kashmir Valley was canceled and the 480 interviews expected to take place there were reallocated to other Muslim-majority areas of the country, including in Jammu, Haryana and West Bengal.
Starting in December 2019, protests broke out in several regions against the country’s new citizenship law that would expedite citizenship for followers of certain religions, excluding, most notably, Muslims. Fieldwork in West Bengal was paused due to the unrest and teams slowly rolled out in the area again starting from January 2020. Delhi field teams were also delayed in their work due to security issues and curfews in study areas.
In March 2020, international concerns for the spread of COVID-19 emerged. Given the safety threat to the field teams, interviews stopped on March 23, 2020, resulting in 39 total villages and census enumeration blocks (1.3% of sample) left incomplete, including the entirety of work in Sikkim and Manipur states.
The Kashmir reallocation and incomplete sampling areas resulted in adjustments to survey weights. Probabilities of selection, cMOS and population parameters were recalculated to exclude Kashmir, Sikkim and Manipur.


