This Pew Research Center study describes the religious makeup of India’s population, how it changed between 1951 and 2011, and the main causes of the change. The analysis focuses on India’s three largest religious groups – Hindus, Muslims and Christians – and also covers Buddhists, Sikhs and Jains when suitable data is available.
Population sizes over time come from India’s decennial census. The census has collected detailed information on India’s inhabitants, including on religion, since 1881. Data on fertility and how it is related to factors like education levels and place of residence is from India’s National Family Health Survey (NFHS). The NFHS is a large, nationally representative household survey with more extensive information about childbearing than the census.
Data on migration is primarily from the United Nations Population Division. Survey responses about religious switching (or conversion) and interfaith marriage are from a Pew Research Center survey of 29,999 Indian adults conducted in late 2019 and early 2020.
References to Indian history, laws, border changes and survey delays are accurate as of Aug. 19, 2021.
For more information, see this report’s Methodology.
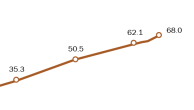
India’s fertility rate has been declining rapidly in recent decades. Today, the average Indian woman is expected to have 2.2 children in her lifetime, a fertility rate that is higher than rates in many economically advanced countries like the United States (1.6) but much lower than India’s in 1992 (3.4) or 1950 (5.9).1
Every religious group in the country has seen its fertility fall, including the majority Hindu population and Muslim, Christian, Sikh, Buddhist and Jain minority groups. Among Indian Muslims, for example, the total fertility rate has declined dramatically, from 4.4 children per woman in 1992 to 2.6 children in 2015, the most recent year for which religion data is available from India’s National Family Health Survey.
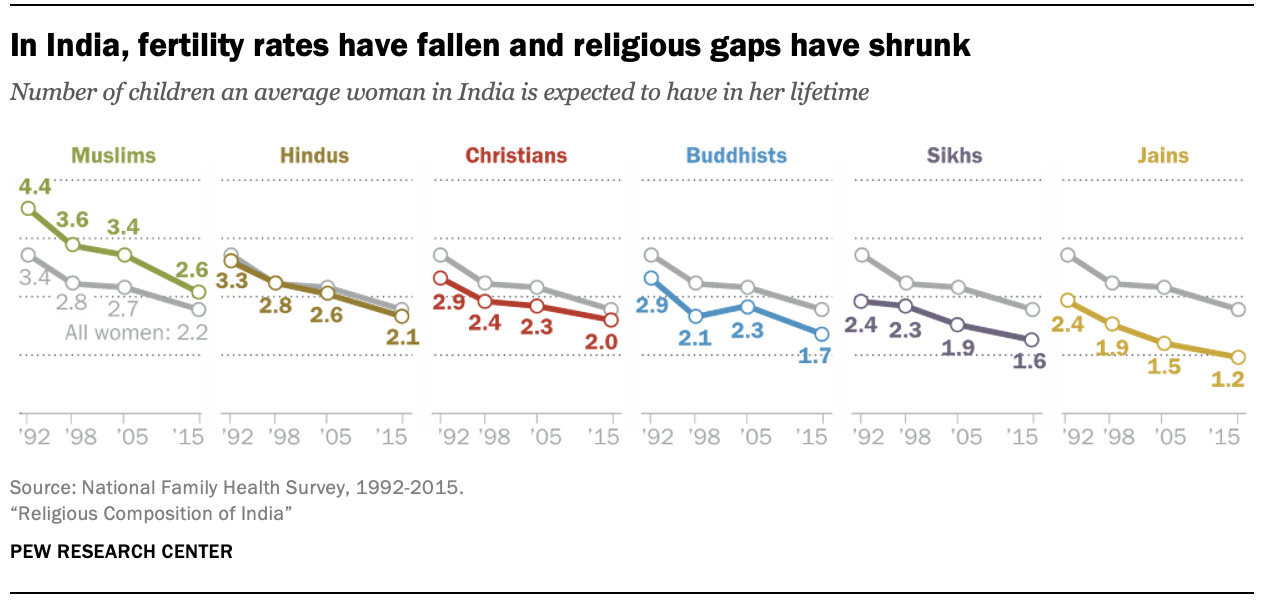
Muslims still have the highest fertility rate among India’s major religious groups, followed by Hindus at 2.1. Jains have the lowest fertility rate (1.2). The general pattern is largely the same as it was in 1992, when Muslims had the highest fertility rate at 4.4, followed by Hindus at 3.3. But the gaps in childbearing between India’s religious groups are generally much smaller than they used to be. For example, while Muslim women were expected to have an average of 1.1 more children than Hindu women in 1992, the gap had shrunk to 0.5 by 2015.
What do these trends mean for India’s religious composition? India’s Muslim population has grown somewhat faster than other religious groups because of fertility differences. But due in part to declining and converging fertility patterns, there have been only modest changes in the overall religious makeup of the population since 1951, when India conducted its first census as an independent nation.
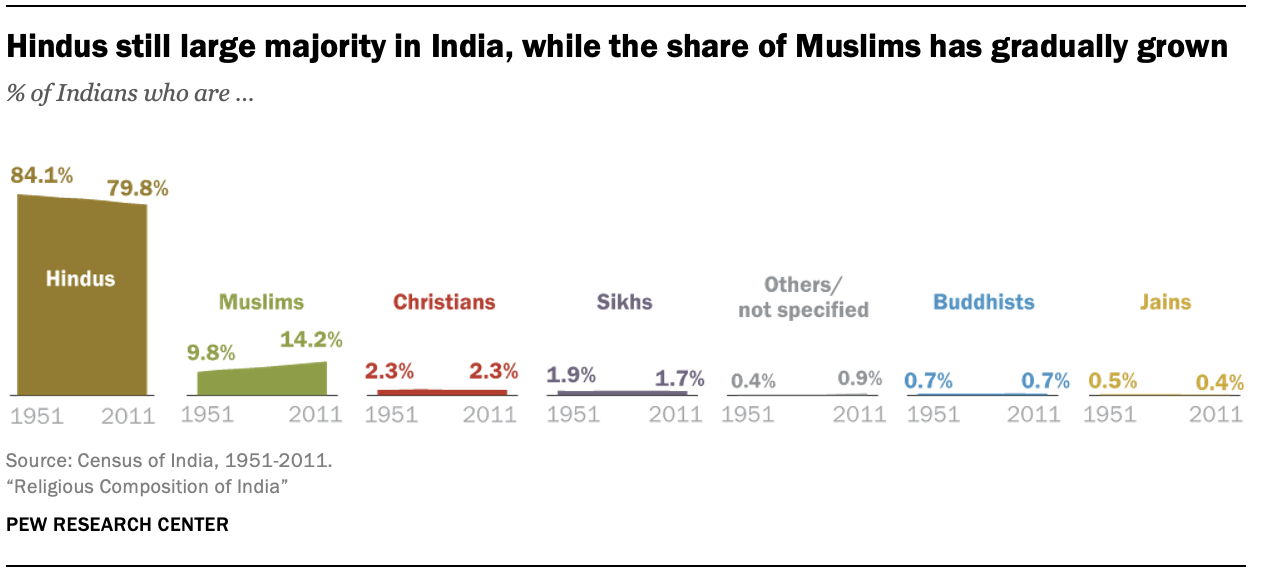
Hindus made up 79.8% of India’s 1.2 billion (120 crore) total inhabitants in the most recent census, conducted in 2011. That is 0.7 percentage points less than in the previous census in 2001, and 4.3 points below the 84.1% recorded in 1951. Meanwhile, the share of Muslims grew from 13.4% in 2001 to 14.2% in 2011 – up by a total of 4.4 percentage points since 1951, when the census found that Muslims comprised 9.8% of India’s population. Christians, Sikhs, Buddhists and Jains, who together make up nearly all of the remaining 6% of the population, were relatively stable in their shares since the 1951 census.2
Related India research
This is one in a series of Pew Research Center reports on India based on a survey of 29,999 Indian adults conducted Nov. 17, 2019, to March 23, 2020, as well as demographic data from the Indian Census and other government sources. Other reports can be found here:
Over the decades, population growth rates have slowed considerably – overall and among Muslims in particular. Before its steep fertility declines, India was on a trajectory that would have resulted in a much larger total population, as well as a greater change in the distribution of religious populations. (See discussion of growth rates in Chapter 1.)
While changes at the national level have been modest, they have not been distributed evenly across India. Some states and union territories have experienced faster population growth or larger changes in religious composition than other states or the country as a whole. For example, the share of Hindus fell by nearly 6% in Arunachal Pradesh but rose by about 2% in Punjab between 2001 and 2011. (See Chapter 3 for more information on the religious demography of India’s states and territories.)
A note on large numbers
India uses a number system that differs from the international number system. This report presents numbers in the international system and, in parentheses, the Indian system. The Indian number system uses units such as lakhs and crores and places commas at different intervals than the international system. Some examples of equivalents:
International number system vs. Indian number system
One hundred thousand (100,000) = 1 lakh (1,00,000)
One million (1,000,000) = 10 lakh (10,00,000)
Ten million (10,000,000) = 1 crore (1,00,00,000)
These are among the key findings of a Pew Research Center demographic analysis of data from India’s census and other sources, designed to complement a major new public opinion survey, “Religion in India: Tolerance and Segregation,” published in June 2021. This analysis looks primarily at trends since India’s independence, which was accompanied by major changes in the country’s religious demographics. The Partition of 1947, at the end of Britain’s long colonial rule, divided the Indian subcontinent along religious lines, causing millions (tens of lakhs) of Muslims to move to the new nation of Pakistan. Meanwhile, millions (tens of lakhs) of Hindus and members of other religious groups migrated to the new India (see sidebar below).
Migration is one of three main mechanisms, along with fertility and conversion, that cause religious groups to shrink or expand. But since the 1950s, migration has had only a modest impact on India’s religious composition. More than 99% of people who live in India were also born in India. Migrants leaving India outnumber immigrants three-to-one, and religious minorities are more likely than Hindus to leave. Religious switching, or conversion – when an individual leaves one religion for another or stops affiliating with any religion – also appears to have had a relatively small impact on India’s overall composition, with 98% of Indian adults still identifying with the religion in which they were raised.
As a result, statistical analysis of census and survey data shows that fertility has been by far the biggest driver of the modest amount of religious change in the decades since Partition (see Chapter 2 for details).3
Religion is only one of many factors tied to fertility rates. While this report describes differences in the fertility patterns of major religious groups in India, it cannot measure the full impact of historical and cultural factors on these patterns, nor can it quantify the direct role that religion plays when it comes to fertility and family size.
In India and elsewhere, education is a primary factor in how many children women tend to have. Other prosperity indicators – such as life expectancy and average levels of wealth – also frequently correlate with fertility measures: Women who have better access to schooling, jobs and health care tend to have fewer children.
Population growth is driven not only by how many children women have, but also by the concentration of women of childbearing age. Younger populations have more women entering their prime childbearing years and, as a result, tend to grow faster than older populations.
In addition, where people live within India, as well as their history and cultural norms (which are harder to measure), play a role in the choices they make about family matters. In short, people’s religion alone does not determine how many children they will have. Religion is just part of a complicated picture.
Sidebar: India’s changing geography
India’s census provides data on the size of its religious groups going back to 1881. But it is a challenge to fully trace changes in the country’s religious composition because domestic and international borders have moved many times since then. Some large regions have become independent nations, while the shape and status of Indian states, princely states and union territories have often shifted.
Generally speaking, India’s external borders have been stable enough since the Partition of 1947 to allow comparisons of national-level figures since 1951. However, the internal lines between Indian states and territories have moved so often since the 1950s that reliable state-level comparisons are possible only for the 2001-2011 decade.
Partition of India
The most significant geographic change since the Indian census began was the Partition of 1947. In the final years of colonial rule, the British faced demands not only to cede independence to India but also to grant sovereignty to Muslim-majority regions in the subcontinent’s northwestern and northeastern corners. As a result, the Independence Act that formally ended British rule also created the country of Pakistan, which at the time encompassed modern-day Bangladesh. Britain did not anticipate the extent of population transfer and chaos that would follow Partition, while poor planning led to last-minute confusion that contributed to a large-scale humanitarian crisis.
Partition was tumultuous from the start. The date for Partition and Independence was moved up by 10 months without much notice, from June 1948 to August 1947. The committee tasked with defining the boundaries of India and Pakistan did not convene until July 1947 and published its decisions two days after Pakistan became independent. Before then, most people knew only that the division would be based on which religious group was in the majority in a given place.
As Muslims migrated to the newly independent Pakistan, Hindus and others migrated to newly independent India. By the end of 1947, approximately 15 million (1.5 crore) people were displaced amid widespread rioting and violence, creating one of the biggest refugee crises in history. By some estimates, more than a million (10 lakh) people died.
States and territories
India’s external and internal borders continued to change after Partition. One way or another, a majority of the 28 states and eight union territories that existed at the writing of this report have gained their current status since the landmark census of 1951.
Given India’s large size, external boundary changes that took place after Partition have not made much difference in the country’s religious demography, even counting the incorporation of small regions such as Goa, which has a significant Christian population. Some external borders changed as Portugal and France – which continued to hold territory for several years after the rest of India became independent – withdrew from the region. Portuguese-held Goa, on the western coast, was seized by India in 1961 and has been included in India’s census since 1971, initially as a union territory and later as a state. Puducherry (formerly held by the French), largely on India’s southeastern coast, became a union territory of India in 1962. In 1975, the people of Sikkim, then an independent country bordering China, voted to make Sikkim India’s 22nd state.
On the other hand, India’s internal borders have been in continual flux since independence, leading to frequent changes in religious composition within states. A dozen new states have been established in the past 50 years alone: Telangana, India’s newest state, was created in 2014. Jammu and Kashmir, formerly a unified state, was reorganized into two union territories in 2019. However, there were no impactful internal border changes between the censuses of 2001 and 2011, the period examined at the state level in this report. During that decade, India had a total of 35 states and union territories.