Latinos have grown pessimistic in the year since the 2024 presidential election. Most say their situation in the United States has worsened. And as Donald Trump’s second term unfolds, Latinos are increasingly critical of his job performance and his administration’s immigration and economic policies – two key issues for Latino voters in last year’s election.
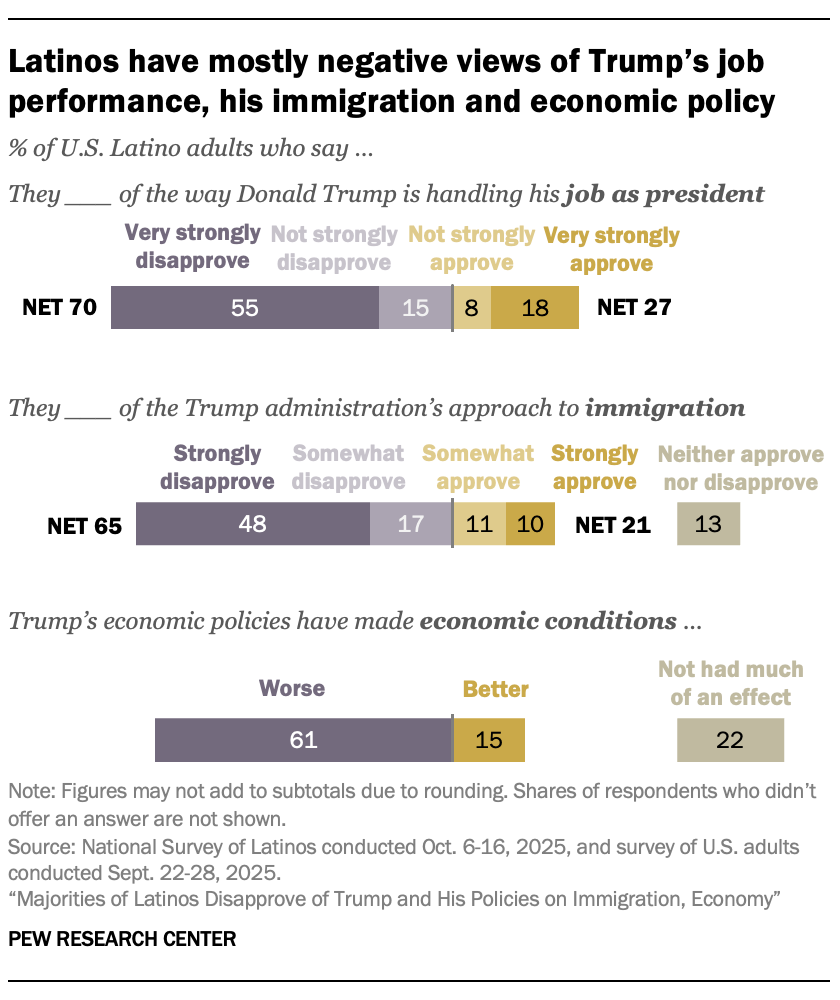
- 70% of Latinos disapprove of the way Trump is handling his job as president.
- 65% disapprove of the administration’s approach to immigration.
- 61% say Trump’s economic policies have made economic conditions worse.
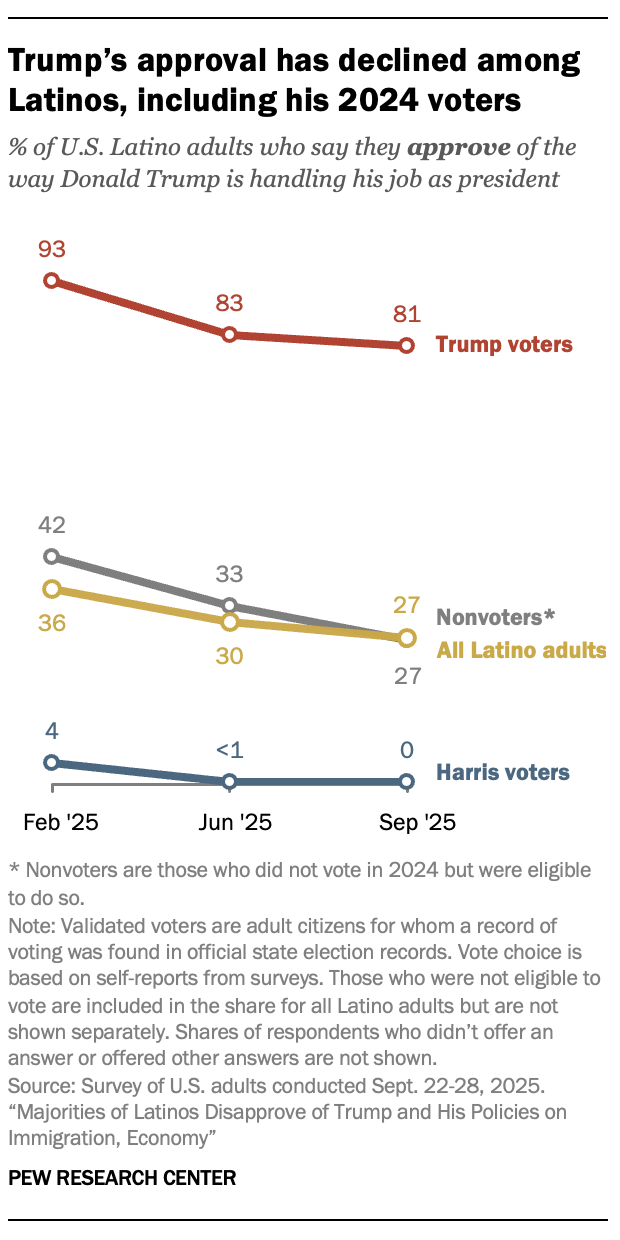
Still, Latinos’ views about Trump and his administration are sharply divided by how they voted in the 2024 election: Those who voted for Trump express strong support for the president and his policies, while those who voted for Kamala Harris hold deeply negative views.
For instance, 81% of Latino Trump voters approve of the president’s job performance, though this share has declined from 93% at the start of his current term. Meanwhile, nearly all Latino Harris voters disapprove of the president. These patterns mirror those among the general U.S. public.
Trump has introduced major changes in economic and immigration policy since returning to office. On the economy, the administration’s tariff policies and the tax and budget bill known as the “Big Beautiful Bill” are among its signature actions. On immigration, his administration has expanded efforts to detain and deport immigrants living in the country illegally while using more aggressive tactics.
In the 2024 election, Hispanic voters were among the groups with the largest shifts toward Trump since 2016. Nearly half (48%) backed him in 2024 – up from 36% in 2020 and 28% in 2016.1
Today, Latinos are the nation’s second largest racial or ethnic group, accounting for one-in-five Americans. They are also among the fastest-growing demographic groups in the United States, making up an increasing share of the country’s population, electorate and labor force.
This report explores Latinos’ perspectives on their situation in the country today and the second Trump administration. It is primarily based on Pew Research Center’s bilingual National Survey of Latinos, conducted in October 2025 with a nationally representative sample of 4,923 Latino adults.
How Latinos see their situation in the country
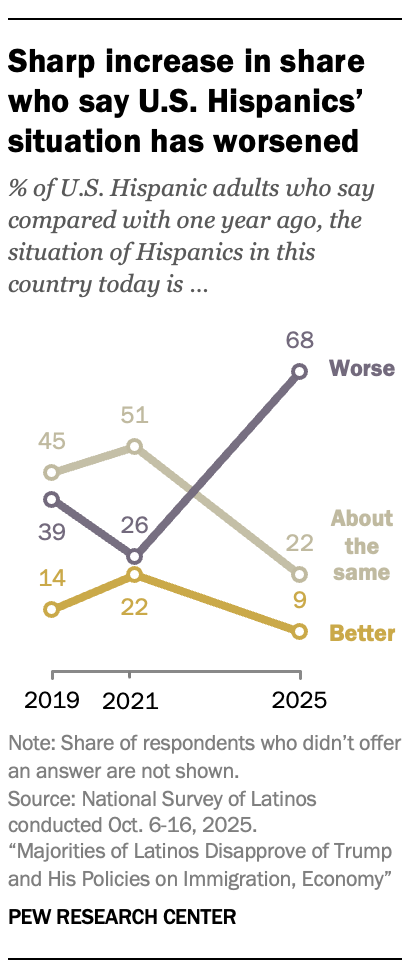
Hispanics are pessimistic about their standing in America. About two-thirds (68%) say the situation of U.S. Hispanics today is worse than it was a year ago, while 9% say it’s better and 22% say it’s about the same.
This is the first time that most Hispanics say their situation has worsened in nearly two decades of Pew Research Center Hispanic surveys.2 When we asked this question in 2019, late during Trump’s first administration, 39% said the situation of U.S. Hispanics had worsened and in 2021, 26% said this.
When asked about how the Trump administration’s policies impact Hispanics overall, far more say they harm Hispanics than help them (78% vs. 10%). These views are more critical than in 2019, when 69% said the first Trump administration’s policies were harmful to Hispanics.
And on how the Trump presidency shapes their feeling of personal belonging in America, more than half of Latinos (55%) say they have serious concerns about their place in the U.S., up from 48% in 2019.
How 2024 Latino voters view their place in the U.S.
Latinos who voted for Trump and Harris in 2024 have sharply different assessments on their place in the country.
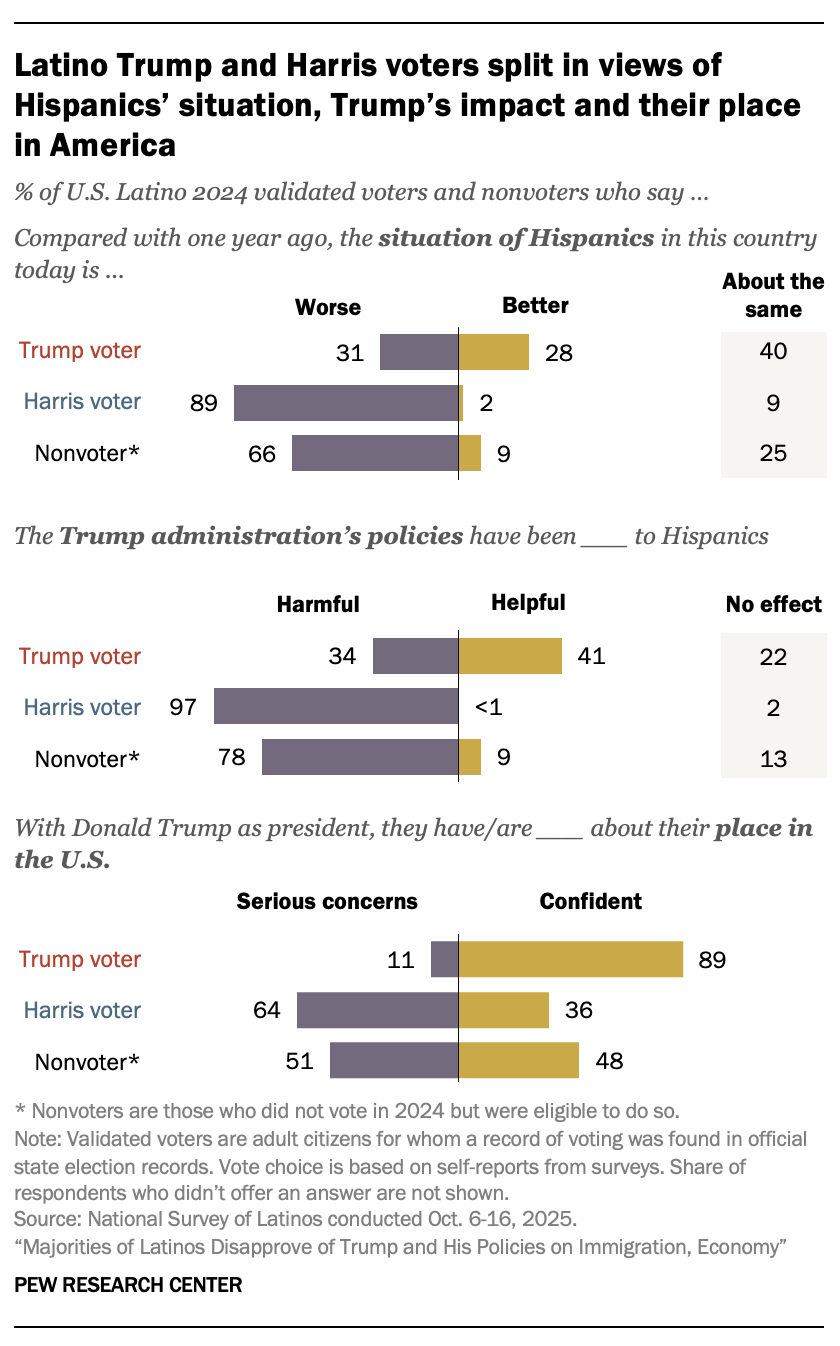
- Situation in the U.S.: 89% of Harris voters say Hispanics’ situation is worse today than a year ago, while 31% of Trump voters say this.
- Trump’s impact on Hispanics: 97% of Harris voters say the Trump administration’s policies have been harmful to Hispanics, while 34% of Trump voters say this.
- Place in America under Trump: 64% of Harris voters say they have serious concerns about their place in the U.S. with Trump as president, while 11% of Trump voters say this.
For more on how Latinos view the president and his impact on Latinos, visit Chapter 1. For more on how they view Latinos’ current and future situation in the country, visit Chapter 2.
How Hispanics see their personal finances and the economy
U.S. Hispanics saw an increase in median household income and a decrease in their poverty rate between 2023 and 2024.3 Still, majorities of Hispanics rated their financial situation negatively in 2024. And ahead of the presidential election, most were highly concerned about the cost of living and cited the economy as a very important issue to their vote.
The October 2025 survey finds that most Hispanics continue to view their financial situation negatively. Nearly two-thirds (63%) say their finances are in only fair or poor shape. In contrast, 37% say they’re in excellent or good shape, a slight improvement from last year when 30% gave this rating.
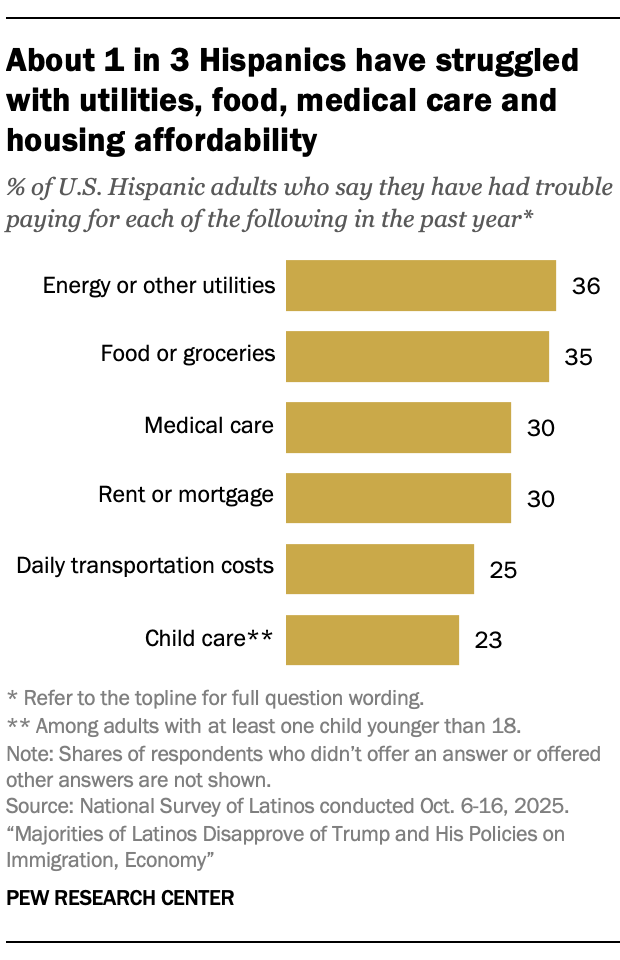
The survey also finds that roughly one-in-three Latinos have struggled to pay for each of the following in the last year:
- Food or groceries (35%)
- Medical care (30%)
- Rent or mortgage (30%)
Notably, about half of Latinos (48%) say they’ve struggled to afford at least one of these three necessities.
And Latinos who work full time are just as likely as Latinos who are unemployed to say they’ve struggled to afford food, medical care and housing.
Despite these difficulties, half of Hispanics (50%) expect their and their family’s financial situation to improve over the coming year, nearly the same share who said this in 2024 (51%).
Additionally, some Latinos have had positive financial experiences in the last year:
- 36% have been able to save money for the future.
- 25% have gotten a pay raise at their current job or a better job.
When asked about the overall U.S. economy, Hispanics’ views are mostly negative and unchanged from 2024. Some 78% say the economy is in only fair or poor shape, while 22% say it’s in excellent or good shape. In 2024, 76% gave the economy a negative rating.
Many Latinos also have a negative outlook on the economy’s future. About half (49%) say the nation’s economy will worsen over the next year, up substantially from 2024. Another 23% say economic conditions will be about the same as now.
For more on how Latinos view their personal finances, visit Chapter 3. For more on their views of the nation’s economy, visit Chapter 4.
Latinos’ experiences and views of immigration policy
Today, 44% of Latinos adults are immigrants, numbering 21.1 million, according to U.S. Census Bureau estimates of the 2024 American Community Survey.
Since the first day of Donald Trump’s second term, immigration has been a key part of his administration’s agenda, including broader efforts to deport immigrants who are living in the country illegally.
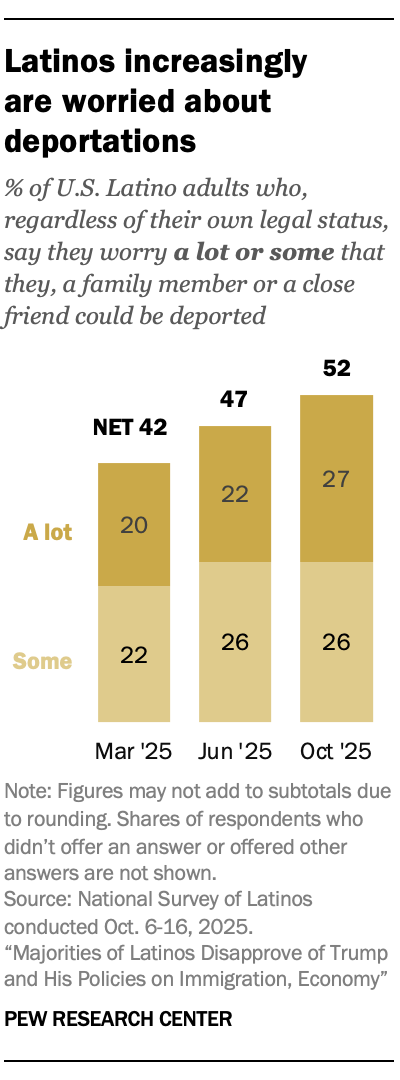
Amid this heightened enforcement, 52% of Latino adults say they worry a lot or some that they, a family member or a close friend could be deported. This is up from 42% in March. Majorities of younger adults, Harris voters, immigrants and those with family origins in Central America now express this worry.
Additionally, a majority of Latinos (59%) say they have seen or heard of Immigration and Customs Enforcement (ICE) raids or arrests in their community in the past six months.
Immigration enforcement has also impacted Latinos’ daily routines:
- 19% say they have recently changed their day-to-day activities because they think they’ll be asked to prove their legal status in the country.
- 11% say they now carry a document proving their U.S. citizenship or immigration status more often than they normally would.
Latinos are increasingly critical of the administration’s approach to deportations. About seven-in-ten (71%) say it is doing too much when it comes to deporting immigrants living in the country illegally, up from 56% in March.
In 2023, the vast majority of Latino adults in the U.S. (82%) had full legal status as U.S.-born citizens, immigrants with naturalized citizenship, or lawful immigrants without citizenship, according to Pew Research Center estimates. Meanwhile, 18% of Latino adults were unauthorized immigrants, a group that includes those without full legal status.4
For more on how Latinos view the Trump administration’s immigration policy, visit Chapter 5. For more on how immigration enforcement is impacting Latinos’ lives, visit Chapter 6.
How have Hispanic Republicans’ views changed under the second Trump administration?
Overall, Hispanic Republicans’ and Republican leaners’ assessments of the administration are mixed. Importantly, Republicans and Trump voters are not the same, though these groups largely overlap.5
The share of Hispanic Republicans who say economic conditions in the country are excellent or good has roughly doubled since last year from 19% to 40%. And 39% of Hispanic Republicans say that since Trump took office, his policies have improved economic conditions, higher than the shares who say the policies made conditions worse (31%) or haven’t had an effect (29%).
At the same time, Latino Republicans have soured on Trump’s immigration policy. About half (47%) now say the administration is doing too much when it comes to deportations, up from 28% in March. Still, the share of Latino Republicans who say they worry that they or someone close to them could be deported is little changed since Trump returned to office (35% say this today).
More broadly, a majority of Hispanic Republicans (55%) now say Trump’s policies have been harmful to Hispanics overall, up from 38% who said the same late in Trump’s first term.
Latino Republicans hold less favorable views of Trump than his 2024 Latino voters
Hispanic Republicans’ views of the president are not as positive as the views of Hispanics who voted for him in 2024.
- Among Hispanics, 67% of Republicans approve of Trump’s job performance, compared with 81% of his voters.
- 55% of Republicans say the Trump administration’s policies have been harmful to Hispanics, compared with 34% of his voters.
- 29% of Republicans say they have serious concerns about their place in the U.S. with Trump as president, compared with 11% of his voters.