For the most part, voting patterns across demographic groups in the 2024 presidential election were not substantially different from the 2020 and 2016 elections. But Donald Trump’s gains among several key groups of voters proved decisive in his 2024 victory.
To explore voting patterns among subgroups over time, refer to detailed tables.
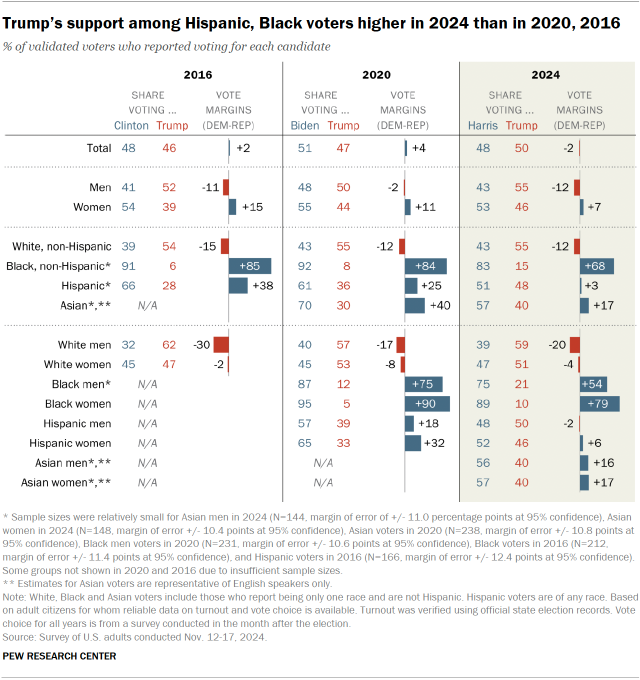
Hispanic voters were divided in 2024, a major shift from 2020 and 2016. In 2020, Joe Biden won Hispanic voters by 25 percentage points, and Hispanic voters supported Hillary Clinton by an even wider margin in 2016. But Trump drew nearly even with Kamala Harris among Hispanic voters, losing among them by only 3 points.
Black voters also moved to Trump but remained overwhelmingly Democratic.
Trump nearly doubled his support among Black voters between 2020 and 2024: 8% voted for him in 2020 vs. 15% last year. Still, 83% of Black voters backed Harris.
Men – especially men under 50 – backed Trump by larger margins. Men supported Trump by a wider margin than in 2020. Trump narrowly won men under age 50, a shift from 2020 when men in that age group favored Biden by 10 points.
As in prior elections, a change in voters’ partisan allegiances – switching from the Democratic to the Republican candidate or vice versa – proved to be a less important factor in Trump’s victory than differential partisan turnout. In the overall electorate and among key demographic groups, Republican-leaning eligible voters simply were more likely to turn out than Democratic-leaning eligible voters in 2024.
And despite some notable changes in the coalitions, many familiar divisions in demographic voting patterns were once again evident. For example, voters with at least four-year college degrees and urban residents voted for Harris by wide margins. By contrast, Trump retained sizable advantages among noncollege voters and voters living in rural areas.
About this report
This Pew Research Center analysis examines voter turnout and voting preferences in the 2024 presidential election through the lens of validated voters. Validated voters are adult citizens who told us that they voted in a postelection survey and have a record showing they voted in their state’s official voter turnout records.
The postelection survey of U.S. adults was conducted Nov. 12-17, 2024, on the American Trends Panel (ATP). The ATP is a panel survey, meaning that we have interviewed many of the same respondents after each national election going back to 2016. This allows us to examine how individuals changed their turnout or candidate preferences over time. For more on how the study was conducted, read the report’s methodology. For more about terms used in the report, refer to the terminology box.
Gender and race in voting preferences in 2024
Men favored Trump by 12 percentage points in the 2024 election, while women favored Harris by 7 points. Trump made gains among men compared with 2020 and held roughly steady among women:
- 55% of men voted for Trump in 2024, up from 50% of men in 2020.
- 46% of women voted for Trump in 2024, compared with 44% of women four years earlier.
Race and ethnicity
A 55% majority of White voters cast ballots for Trump in 2024. An identical share of White voters favored Trump in 2020, and 54% selected him in 2016.
White men favored Trump by a margin of 20 points in the most recent election. White women favored Trump by a narrower 4-point margin.
Though most Black voters continued to prefer the Democratic candidate, a larger share of Black voters cast ballots for Trump in 2024 than in 2020 or 2016. Roughly eight-in-ten Black voters (83%) reported voting for Harris in 2024, while 15% favored Trump. In 2020, 8% of Black voters reported voting for Trump, and just 6% of Black voters favored him in 2016.
Black men and women alike were more likely to vote for Trump in 2024 than in 2020. One-in-ten Black women and 21% of Black men voted for Trump in the most recent election.
Increased shares of Black voters who favored Trump were driven not by individuals shifting their preferences, but by changes in who turned out to vote. While some Black voters did indeed switch from Biden in 2020 to Trump in 2024, these defections were largely canceled out by Black voters who switched in the opposite direction.
Nearly half of Hispanic voters backed Trump. His support among Hispanic voters was 12 points higher than in 2020 (48% in 2024, 36% in 2020). And the share voting for the Democratic candidate fell from 61% to 51%.
In 2024, Hispanic women and Hispanic men were divided in their preferences for president. In 2020, Hispanic women were more likely than Hispanic men to vote for the Democratic candidate.
Again, these changes were primarily driven by changing turnout patterns: 9% of eligible Hispanic voters voted in 2020 but not in 2024, and these voters favored Biden in 2020 by roughly two-to-one (69% to 31%). By contrast, among Hispanic eligible voters who voted in 2024 but not in 2020, 60% voted for Trump in 2024 and 37% voted for Harris.
Asian voters favored Harris in 2024, with 57% voting for her. Four-in-ten Asian voters (40%) cast ballots for Trump, up from 30% in 2020.
Asian men and women favored Harris by nearly identical margins (16 and 17 points, respectively).
Age and the 2024 vote
Consistent with other recent elections, younger voters tended to favor the Democratic candidate while older voters tended to favor the Republican.
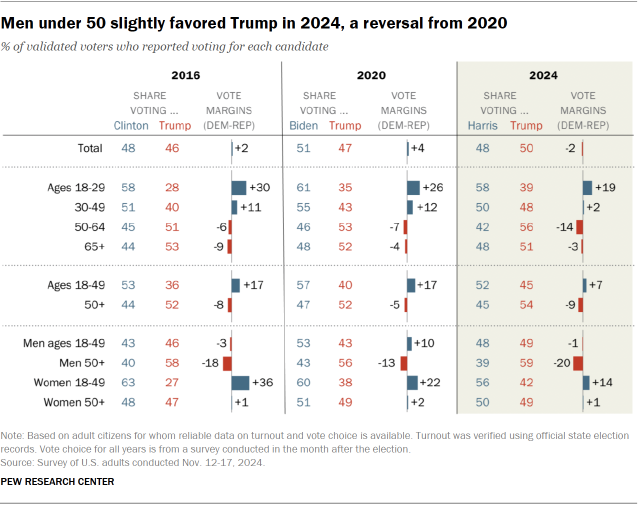
Voters ages 18 to 49 favored Harris by 7 percentage points in 2024, compared with a 17-point margin for Biden in 2020. Changing vote patterns were driven in part by defections among young voters: 8% of Biden’s 2020 voters under 50 switched to Trump in 2024, while 4% of voters in this group went from Trump to Harris.
The share of voters ages 50 and older who favored Trump was essentially unchanged across the two most recent presidential elections: 54% voted for Trump in 2024, compared with 52% in 2020.
Vote margins shifted among men under 50. In 2024, men under 50 were divided in their preferences: 49% voted for Trump, while 48% supported Harris. By contrast, in 2020, Biden won men under 50 by 10 points (53% to 43%).
Age cohorts
The group of voters who were under age 50 in 2024 is not identical to the group of voters who were under age 50 in 2020: Some voters aged out of this group, while other young adults became newly eligible to vote. Looking at age cohorts – groups of people defined by when they were born as opposed to how old they are – allows us to see how the same subset of voters have changed over time.
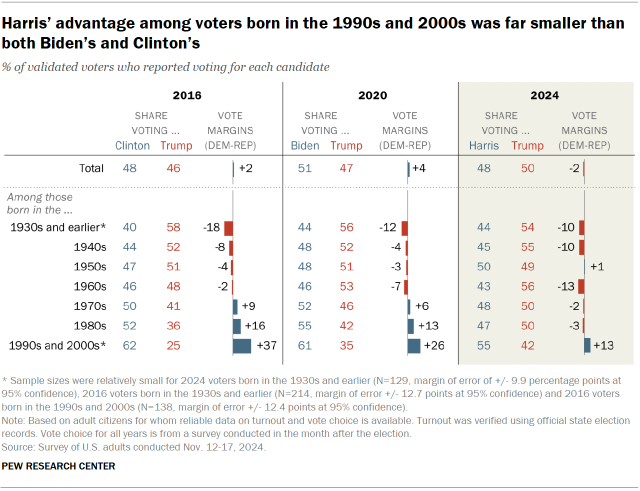
Most age cohorts of voters saw only small shifts in their candidate preferences between the 2020 and 2024 elections. However, those born in the 1980s and those born in the 1990s or 2000s stand out: Members of both groups became more likely to favor Trump between 2020 and 2024.
Defections played a significant role in the changing voting patterns of those born in the 1980s: 8% of 2020 Biden voters in this group switched their votes to Trump in 2024, while just 2% of 2020 Trump voters born in the ’80s switched their votes to Harris. Among those born in the 1990s or 2000s, changes in who turned out to vote accounted for the shift in Trump’s favor.
Education and the 2024 election
As has been the pattern through several elections, voters were sharply divided in 2024 by whether they have a college degree. Voters with a four-year degree or more education – who constitute about 40% of all voters – favored Harris by a double-digit margin (16 percentage points), while those without a college degree favored Trump by nearly as much (14 points).
College graduates and non-college graduates alike were slightly less likely to vote for the Democratic candidate compared with four years earlier.
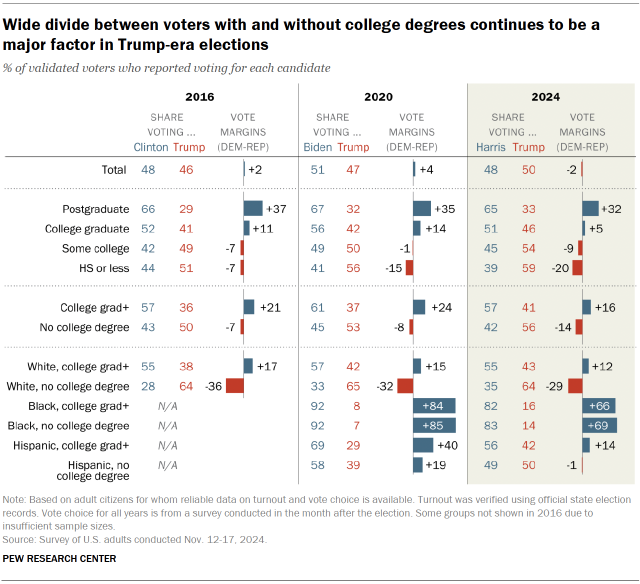
Voters with postgraduate degrees remained a strong Democratic group. Voters with postgraduate degrees favored Harris by roughly two-to-one (65% to 33%), which is similar to Biden’s and Clinton’s advantages in the past two elections. Harris led more narrowly among those with no more than a four-year degree, while Trump won by large margins among those with less formal education.
Educational differences among White and Hispanic voters, but not Black voters. White noncollege voters were about 20 points more likely to support Trump than those with a four-year degree; that is similar to the difference four years ago. Noncollege Hispanic voters also were more likely to back Trump than Hispanic voters with college degrees, but the gap was smaller than among White voters. There were no meaningful educational differences among Black voters.
Party and ideology in the 2024 election
Among people who voted, more than nine-in-ten Republicans (95%) voted for their party’s candidate in the 2024 election, and an identical share of Democrats voted for Harris. Including those who lean toward one of the two major parties, 92% of Republicans and Republican-leaning independents voted for Trump, while 94% of Democrats and Democratic leaners voted for Harris.
In 2020, 95% in each party also voted for their party’s nominee.
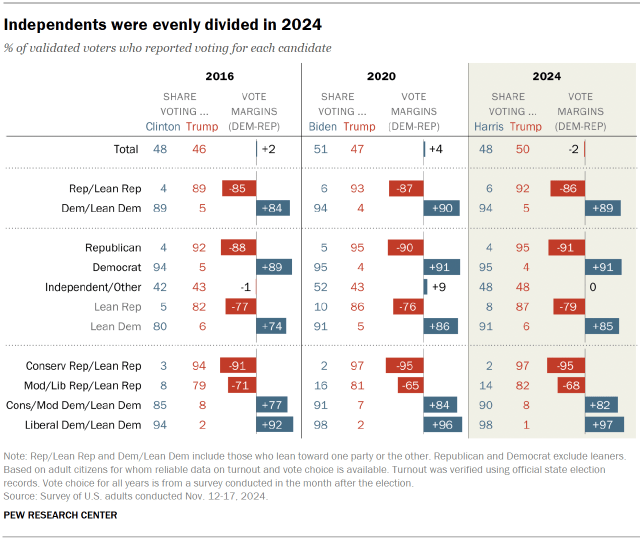
Independents (including those who lean toward one party or the other) were evenly divided in 2024, with 48% voting for Harris and 48% for Trump. Four years ago, this group favored Biden by 9 percentage points.
As in past elections, ideology was closely related to vote choice:
- 97% of conservative Republicans and Republican leaners voted for Trump.
- 82% of moderate and liberal Republicans and Republican leaners voted for Trump.
- 90% of conservative and moderate Democrats and Democratic leaners voted for Harris.
- 98% of liberal Democrats and Democratic leaners voted for Harris.
Community type and voting preferences in 2024
The urban-rural divide, already a major factor in presidential elections, grew in 2024 as rural voters favored Trump by an even larger margin than they did in 2020.
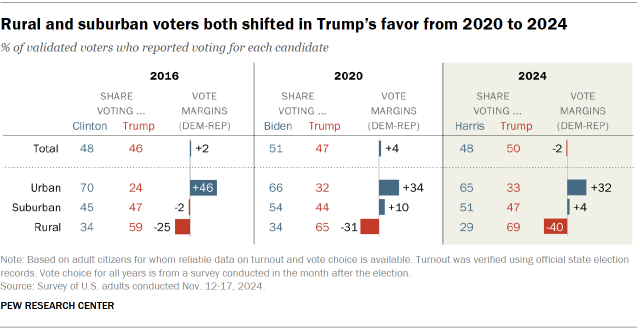
Nearly seven-in-ten validated voters who describe their communities as rural (69%) voted for Trump in 2024, while 29% voted for Harris. In 2020, 65% of rural voters favored Trump and 34% favored Biden. In 2016, 59% voted for Trump and 34% cast ballots for Clinton.
Trump benefited from rural voters defecting to him in addition to changing turnout patterns: 7% of Biden’s rural 2020 voters who voted in both elections converted into Trump voters in 2024, while just 3% of Trump’s rural 2020 voters switched to Harris.
Trump also benefited from changing turnout patterns – though not from significant defections – among suburban voters. Suburban voters continued to favor the Democratic candidate, but by a smaller margin than in 2020 (a 4-point margin in 2024 vs. 10 points in 2020).
While Harris maintained the Democrats’ substantial advantage among urban voters, she did not make any gains within this group to offset her losses among suburban and rural voters. Urban voters favored Harris by roughly a two-to-one margin (65% vs. 33%) in 2024, just as they favored Biden by roughly two-to-one in 2020 (66% vs. 32%).
Religion and the presidential election
Religious groups voted along familiar lines in 2024, even as Trump gained among Protestants, Catholics, and those who reported attending religious services on at least a monthly basis.
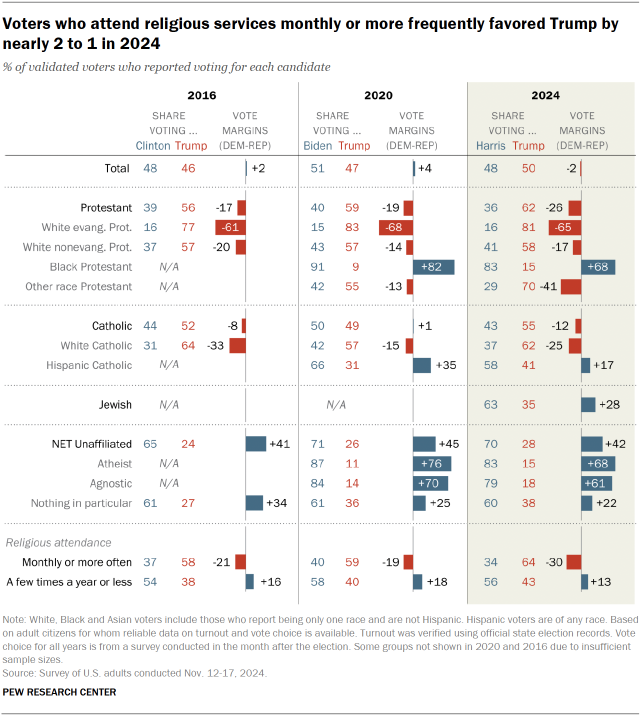
Protestants
Trump’s margin among all Protestant voters increased to 26 percentage points in the most recent election (from 19 points in 2020), with 62% of Protestants favoring him. Trump’s gains among Protestants included small but significant gains from defectors: 5% of Protestants who voted for Biden in 2020 switched to Trump in 2024, while just 3% of Trump’s 2020 Protestants went to Harris.
Trump also gained – through changes in turnout – among Black Protestants and among Protestants of a race or ethnicity other than White or Black.
White evangelical Protestants continued to overwhelmingly favor Trump: 81% voted for Trump in 2024, compared with 83% in 2020. And nearly identical majorities of White nonevangelical Protestants voted for Trump in 2024 (58%) and 2020 (57%).
Catholics
Trump won a majority of Catholic voters, taking 55% of the Catholic vote to Harris’ 43%. Four years earlier, Catholics split almost evenly: 50% voted for Biden and 49% for Trump.
As with Protestants, Trump benefited from a small advantage among Catholic defectors: 7% of 2020 Biden voters converted to Trump voters in 2024, while just 4% of Catholics who favored Trump in the earlier election shifted to Harris. The remainder of Trump’s gains with this group came from changes in turnout.
The religiously unaffiliated
Unaffiliated voters continued to favor the Democratic candidate, with 70% voting for Harris and 28% voting for Trump. Four years earlier, 71% of religiously unaffiliated voters selected Biden and 26% selected Trump.
Attendance at religious services
Trump in 2024 won a larger share of voters who attend religious services at least once a month than he did in 2020. The same was true among voters who attend less frequently.
Among frequent attenders, Trump’s share of voters increased to 64% from 59% in 2020. Among less frequent attenders, it increased to 43% from 40%.
Voting patterns among naturalized citizens
For the 2024 and 2020 presidential elections, we have sufficient data to look at vote choice among citizens who report having been born in another country – in other words, naturalized U.S. citizens.
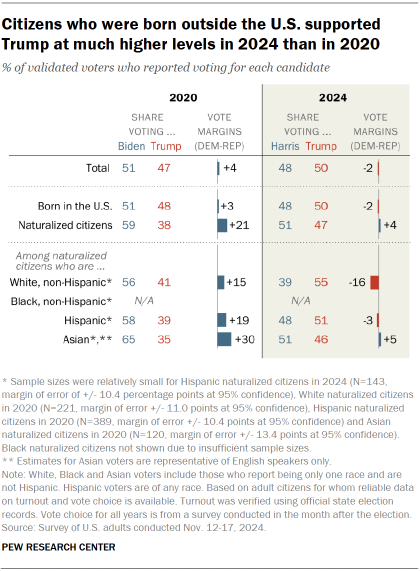
Naturalized citizens were closely divided in the 2024 election: About half (51%) voted for Harris and 47% voted for Trump.
This marked a shift from four years ago, when naturalized citizens backed Biden by a wide 59%-38% margin.
While a small share of naturalized citizens switched from voting for Biden in 2020 to Trump in 2024, these defectors were canceled out by voters who switched from Trump to Harris. Trump’s gains among naturalized citizens were instead driven by different voters turning out to cast ballots across the two elections.
Roughly two-in-ten naturalized citizens who voted in 2024 had not voted in 2020 (22%), and a 57% majority of this group voted for Trump in 2024. Meanwhile, among the naturalized citizens who voted in 2020 but dropped off in 2024, 67% were Biden voters in the earlier election.
Race and ethnicity among naturalized citizens
White, Hispanic and Asian naturalized citizens each shifted at least somewhat in Trump’s direction between 2020 and 2024, due primarily to changes in turnout:
- 55% of White naturalized citizens voted for Trump in 2024, compared with 41% in 2020.
- 51% of Hispanic naturalized citizens voted for Trump, up from 39% in 2020.
- 46% of Asian naturalized citizens voted for Trump, an increase from 35% in 2020.


