In his third run for president in 2024, Donald Trump defeated Kamala Harris by 1.5 percentage points overall, winning 312 Electoral College votes and the national popular vote for the first time.
Trump won with a voter coalition that was more racially and ethnically diverse than in 2020 or 2016, according to a new Pew Research Center analysis of the 2024 electorate.
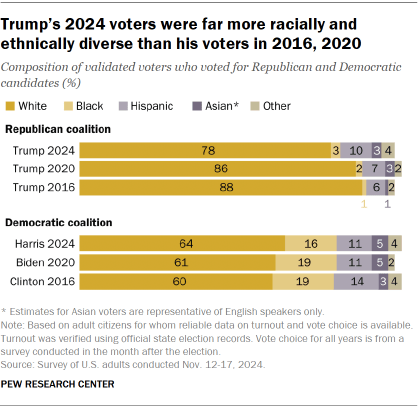
- Among Hispanic voters, Trump battled to near parity in 2024 (51% Harris, 48% Trump) after losing to Joe Biden 61%-36% in 2020.
- Trump won 15% of Black voters – up from 8% four years earlier.
- Trump also did better among Asian voters. While a majority of Asian voters (57%) backed Harris, 40% supported Trump. This was a narrower margin than Biden’s in 2020 (70% to 30%).
These shifts were largely the result of differences in which voters turned out in the 2020 and 2024 elections. As in the past, a relatively small share of voters switched which party’s candidate they supported.
In 2024, Trump benefited from higher turnout among those who voted for him in 2020. He also held an edge over Harris among voters who did not vote four years earlier – a group that was considerably more diverse than those who voted in both elections.
And while Trump improved his performance among several groups in 2024, many of the demographic patterns in voting preferences that have dominated American politics for the last several decades remained evident last November:
Educational divide. In each of his campaigns, Trump has held an edge among voters without four-year college degrees. But his 14-point advantage among noncollege voters (56% to 42%) was double his margin in 2016. Harris won voters with college degrees by 57% to 41%, but that was smaller than Biden’s lead among this group in 2020.
A wider urban-rural gap. Trump won voters living in rural areas by 40 points (69%-29%), which was higher than his margins in 2020 or 2016. Harris’ advantage among voters living in urban areas was nearly as large (65% voted for Harris, 33% Trump).
Continued differences by religious attendance. Nearly two-thirds of voters who attend religious services monthly or more (64%) voted for Trump, while only about a third (34%) supported Harris. Harris held a narrower advantage (56%-43%) among the larger group of voters who attend services less frequently.
For more on voting patterns, refer to Chapter 2.
About this report
This Pew Research Center analysis examines voter turnout and voting preferences in the 2024 presidential election through the lens of validated voters. Validated voters are adult citizens who told us that they voted in a postelection survey and have a record showing they voted in their state’s official voter turnout records.
The postelection survey of U.S. adults was conducted Nov. 12-17, 2024, on the American Trends Panel (ATP). The ATP is a panel survey, meaning that we have interviewed many of the same respondents after each national election going back to 2016. This allows us to examine how individuals changed their turnout or candidate preferences over time. For more on how the study was conducted, read the report’s methodology. For more about terms used in the report, refer to the terminology box.
From Biden 2020 to Trump 2024: A tale of differential turnout and changing voter preferences
While most of those who voted in 2020 cast ballots again in 2024, a larger share of Trump’s voters (89%) than Biden’s (85%) turned out.
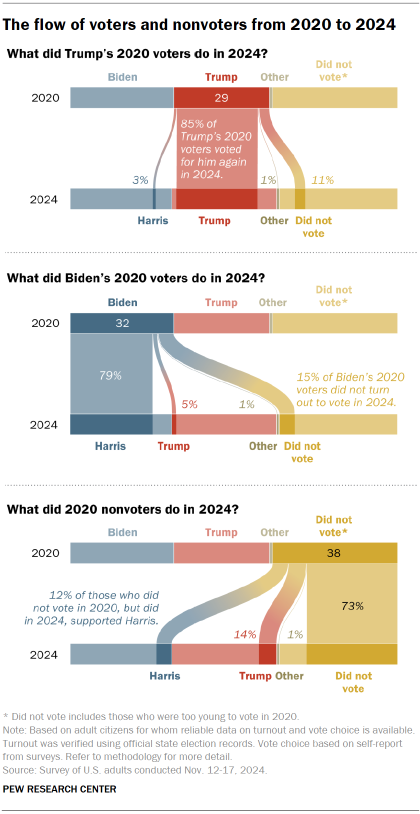
And a larger share of those who did not turn out in 2020 – but did in 2024 – supported Trump (54%) than Harris (42%).
What 2020 voters did
Between 2020 and 2024, 85% of those who backed Trump in 2020 did so again in 2024. About one-in-ten of his 2020 voters (11%) didn’t turn out in 2024, and 4% voted for Harris or someone else.
Harris received 79% of Biden’s 2020 voters. Compared with Trump’s 2020 voters, a larger share of Biden’s didn’t vote in 2024 (15%), and 6% voted for Trump or another candidate.
What new and returning voters did
Most adults who were eligible to vote in 2020 – but declined to do so – stayed home again in 2024. But among those who did turn out, Trump had the edge. Among all 2020 nonvoters (including those who were too young and ineligible to vote in 2020), 14% supported Trump in 2024 while 12% supported Harris.
Stability and change
Roughly three-quarters of eligible adults did the same thing in 2024 as they did in 2020: voted for a candidate of the same party or did not turn out.
And about a quarter of eligible adults did something different in 2024 than in 2020: They switched their vote choice, voted in 2024 when they had not voted in 2020, or did not vote in 2024 after voting in 2020.
Harris would not necessarily have benefited from higher voter turnout
When asked how they would have voted, people eligible to vote who did not do so were fairly evenly split in their preferences: 44% said they would have supported Trump, while 40% said they would have backed Harris.
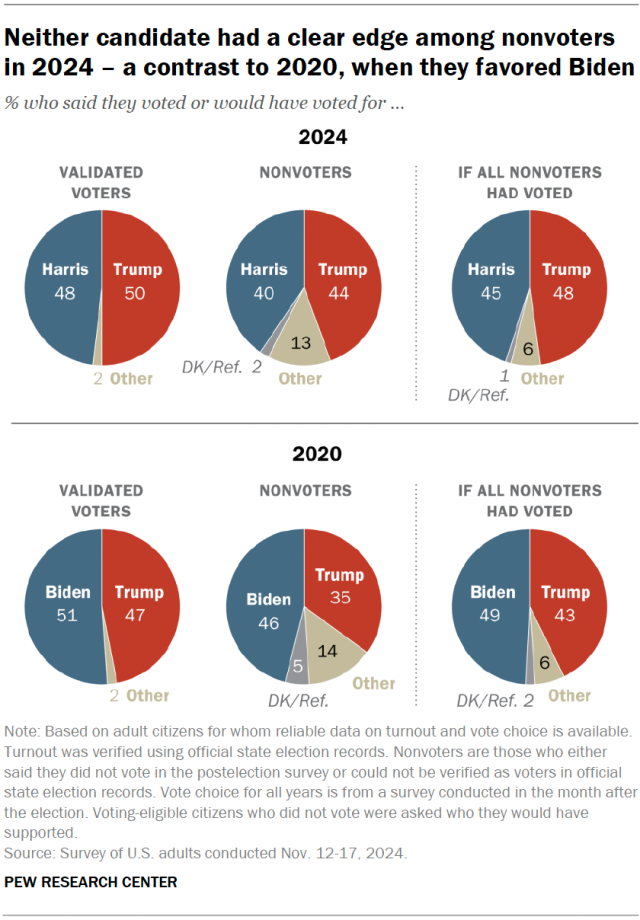
This is a stark contrast to 2020, when those who didn’t vote expressed a clear preference for Biden over Trump (46% to 35%). Democrats have held an edge among nonvoters in prior elections dating back to at least the 1960s – though there is some evidence this advantage had declined in recent elections.
As a result, if all Americans eligible to vote in 2024 had cast ballots, the overall margin in the popular vote likely would not have been much different.
In contrast, if all eligible Americans had voted in 2020, Biden’s margin of victory would likely have increased.
Other key findings
Naturalized citizens – immigrants who hold U.S. citizenship – who voted in the election split their votes about evenly, with 51% voting for Harris and 47% for Trump. In 2020, naturalized citizens favored Biden by 21 percentage points: 59% to 38%. In 2024, naturalized citizens made up 9% of voters.
Trump made gains among men – especially men under 50. Men favored Trump by 12 points (55%-43%) after being closely divided in 2020. In particular, men under 50 split their votes fairly evenly this year (49% Trump, 48% Harris). In 2020, this group backed Biden by 10 points (53% Biden, 43% Trump).
Even in an era of high-turnout elections, many eligible Americans remain on the sidelines. The 64% turnout rate in 2024 was the second highest since 1960, behind only 2020. However, about a quarter of Americans eligible to vote (26%) have no record of voting in any of the last three national elections (2020, 2022, 2024). These Americans are disproportionately young and much less likely to have four-year college degrees than those who vote more frequently.
For more on voter turnout, refer to Chapter 1.
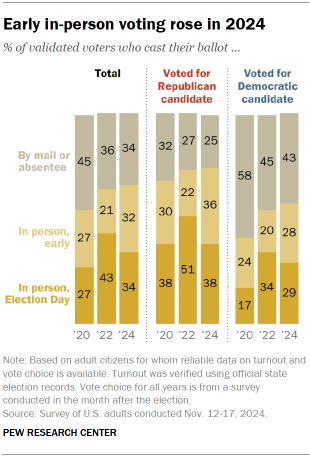
In-person early voting has grown in popularity. Nearly a third of 2024 voters (32%) cast their ballot in person prior to Election Day, up from 27% in 2020. Another 34% cast their ballot in person on Election Day.


