
There are two big reasons why many pollsters now weight their surveys on political characteristics such as party affiliation or past vote, when this wasn’t common practice a decade ago: to correct for a systematic bias that emerged around 2016 and to protect against poll-to-poll volatility driven by who participates rather than real changes in opinion. Both challenges have been exacerbated by the decline in survey response rates.
(This is part of a larger Pew Research Center report about political weighting – adjusting a survey to reflect the political composition of the United States as accurately as possible. For an overview and the report’s key takeaways, read “Weighting Polls on Party Affiliation and Past Vote.”)
A root cause: Low response rates make surveys more vulnerable to errors
The biggest obstacle surveys face today is that it has gotten much harder to reach people and persuade them to consent to an interview. The nature of the problem is evident in the trend for Pew Research Center’s telephone survey response rates over the period between 1997 and 2021.
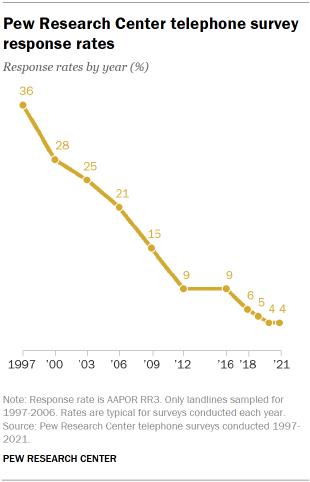
Response rates dropped from 36% in 1997 to the low single digits in recent years. The New York Times/Siena telephone poll reported a 0.4% response rate in 2022. Overall participation rates in online surveys are not very different. The Center’s American Trends Panel surveys have a response rate of about 3% when considering the response rates of the recruitment surveys, invitations to enroll in the panel and wave-to-wave nonresponse.
The fact that most people selected for surveys cannot be reached or do not respond increases the potential for nonresponse bias when participants differ from nonparticipants in ways that are not corrected by weighting.
Recently, pollsters have been fighting a systematic bias
There is growing evidence that Republicans have become slightly less likely than Democrats to take part in polls – especially in presidential elections – which may have led to underestimates of the strength of Donald Trump and other Republican candidates in 2016, 2020 and 2024. The problem appears to have been less serious in the midterm elections of 2018 and 2022, but even in 2022 some polls underestimated support for Republican candidates. Pollsters have a name for this issue: partisan nonresponse bias.
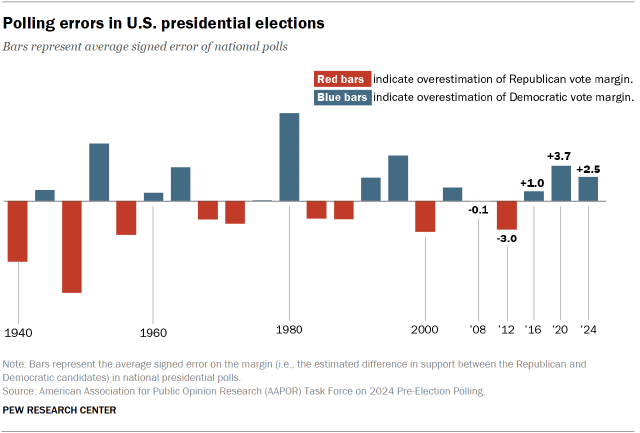
Historically, well-designed polls have a good track record producing estimates close to the eventual election outcomes, both in the U.S. and elsewhere in the world. This may be surprising to some readers, who have read about or recall spectacular errors like those in 1948, when polls incorrectly predicted that Republican Thomas Dewey would defeat President Harry Truman, or in 1980, when polls suggested the election would be close. (It wasn’t: Republican Ronald Reagan defeated incumbent President Jimmy Carter by nearly 10 percentage points.)
But for a long time after 1980, polling got better. Polls in the 2000, 2004, 2008 and 2012 presidential elections were pretty accurate. The 2000 and 2012 elections featured slightly larger errors than 2008, and in both years the polls slightly overstated the Republican candidate’s support.
In this environment of mostly small polling errors that ran in both directions, Trump’s 2016 victory was shocking to many people. National polling slightly overstated Hillary Clinton’s vote share, but state polls in key battleground states had more sizable errors.
Polling in the 2020 election was even worse, again with a Democratic overstatement. A postelection review of the polls by the American Association for Public Opinion Research (AAPOR) stated, “The 2020 polls featured polling error of an unusual magnitude: It was the highest in 40 years for the national popular vote and the highest in at least 20 years for state-level estimates of the vote in presidential, senatorial, and gubernatorial contests.”
In 2024, more pollsters weighted on party affiliation or recalled vote. The polling errors were generally smaller than in 2020, though the errors ran in the same direction. For a third presidential election in a row, most polls underestimated support for Trump.
It’s important to keep in mind that the absolute size of these errors is usually small – for example, an average of less than 5 percentage points on the margin between the candidates. But in a closely divided country where elections have been decided by razor-thin margins, errors of this size are highly consequential.
In the current polling environment, careful weighting on political outcomes tends to help. It reduces the overrepresentation of Democrats, increases the estimated share of Republicans and in turn increases polling accuracy compared with election outcomes.
Another reason for weighting on party affiliation: Bouncing poll numbers
Pollsters who conduct surveys by telephone have long noticed that party affiliation trends (and support for one party’s candidate or the other) are “noisy.” They tend to bounce up and down over time, often for no obvious reason.
But some of these bounces do appear to have a reason. For example, pollsters usually see a rise in support for a presidential candidate after the candidate’s nominating convention – a so-called convention bounce (though these have been much smaller in recent elections). Do these bounces really reflect changing opinions on the part of voters? Perhaps, but they sometimes dissipate.
Similarly, highly visible positive and negative campaign events (e.g., perceptions that President Barack Obama did poorly in his first debate with Mitt Romney in 2012, or the 2016 Access Hollywood revelations about Trump’s comments about women) tend to be followed by shifts in the polls. Both candidates “recovered” and ultimately did better on Election Day than their polls suggested they would.
Political analysts argue that such shifts do not reflect enduring change in party affiliation or candidate choice, but rather mostly reflect a temporary fall-off in the willingness of a candidate’s partisans to take part in polls.
Pollsters with access to survey panels that include information about their panelists’ party affiliation could see that events in the campaign were associated with their willingness to take part in surveys conducted shortly afterward. This seems to be especially consequential as response rates to polls have fallen dramatically over the past several decades. (This is one reason the type of weighting we employ for the American Trends Panel can be critical, as it specifically addresses differential partisan nonresponse.)
This phenomenon is likely most common during periods of heightened public attention to politics, such as a presidential campaign. But it illustrates the hazards of trying to estimate party affiliation with surveys that have very low response rates. For many pollsters, a safer route is to adjust the political balance of their poll so that the relative shares of Republicans and Democrats remain relatively stable and broadly representative, rather than swayed by the latest news.
Jump ahead for FAQs about political weighting, including its shortcomings.


