
Pollsters vary in how they weight their survey samples on political characteristics, if at all. Their choices tend to be informed by factors such as the population being surveyed and the sample source (e.g., a list of all addresses in the United States or a list of registered voters), the focus of the poll (preelection standings or key issues), and geographic level (national, state or something else). No one approach is clearly superior in all contexts.
This section describes three ways to adjust a poll’s political balance with weighting. Some polls use more than one of these adjustments. They’re not mutually exclusive.
(This is part of a larger Pew Research Center report about political weighting – adjusting a survey to reflect the political composition of the U.S. as accurately as possible. For an overview and the report’s key takeaways, read “Weighting Polls on Party Affiliation and Past Vote.”)
Weighting on self-reported party affiliation
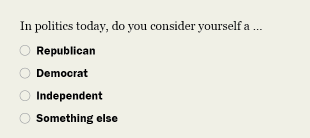
How it generally works: Respondents indicate whether they consider themselves a Republican, Democrat or neither (and whether they lean to either party). After fielding, the pollster aligns the share of Republicans in the survey to match the share nationwide. They do this for Democrats as well. The result is that the survey accurately matches the benchmark shares of Republicans and Democrats.

In practice, this can be tricky because none of the large federal surveys that pollsters use to obtain weighting targets measure party affiliation. Pollsters who survey U.S. adults (not just voters) sometimes use Pew Research Center’s National Public Opinion Reference Survey (NPORS) or their own address-based survey for a party affiliation benchmark.
- Examples of pollsters that have done this: CNN, Pew Research Center, Washington Post/ABC News/Ipsos
Weighting on past vote
How it generally works: Respondents who voted in a recent election report which candidate they voted for. After fielding the survey, the pollster aligns it with official election data for turnout and vote choice. A slight variation on this approach aligns the survey with a modeled estimate for how present-day registered voters cast their ballot in the last election.
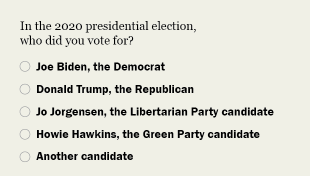
In theory, this guarantees that the portion of the sample made up of people who voted in the last election is properly balanced with the election’s actual result.
Recently, pollsters have been researching how best to resolve wrinkles, such as participants who were not eligible to vote last time or refused to say whom they supported. Making an educated guess about how these people would have voted (what The New York Times describes as “synthetic past vote”) seems to work better than leaving them out of the adjustment.
- Examples of pollsters that have done this: CBS News, Echelon Insights, Elon University, Morning Consult, New York Times/Siena, Pew Research Center, Washington Post/ABC News/Ipsos
Weighting on political data from a registered voter file
How it generally works: While registered voter files don’t record which candidate someone voted for, they do contain various kinds of political information that can be used in weighting.
Some variables are administrative records of past behavior, such as whether someone registered to vote (and with what political party, in states that offer the option to choose a party), what mode of voting they used, and whether they voted in a partisan primary.
Some information within the voter files is modeled, that is, inferred from a combination of characteristics such as where people live, whether they have voted in primary elections, their age, gender, race and ethnicity, and other factors. In 2024, some pollsters weighted their surveys on modeled party affiliation and modeled vote choice.
- Examples of pollsters that have done this: CNN (state polling), Echelon Insights, Emerson College, New York Times/Siena, Washington Post (state polling)
Each of these approaches has strengths and weaknesses that make it more appropriate for some types of surveys than others. Here is a summary table with different considerations and situations, along with the pros and cons of each weighting method.
Comparing 3 ways to weight a poll on political party or vote
Type of weighting adjustment
| Political party (self-reported) | Past vote choice (self-reported) | Party registration or party primary election turnout (voter file) | |
| Does the weighting target fix the political balance for voters and nonvoters? | Yes | No. Works for voters only | No. Works for registered voters only |
| Does the weighting work for state/local polls? | Theoretically yes, but targets for party affiliation are harder to find at the subnational level | Yes | Yes |
| Is there an easily available benchmark? | No | Yes – election results | Mixed – varies by state |
| Risk from self-report errors? | Lower than past vote. Respondents tend to report their party affiliation accurately | Higher but still tolerable. Studies have found biases in people’s recall of past vote choice and turnout, but for 2016 and after this adjustment still tends to help | None, though matching and modeling errors can occur |
| Stable benchmark over time? | No. The share of Americans who are Republicans and Democrats changes | Yes, unless the pollster chooses to model the election result | Mostly stable as it is an administrative characteristic |
| Other considerations | Requires careful timing between benchmark and poll | Can overstate similarity to prior election; recall accuracy varies by political engagement and time elapsed | Excludes voters without current contact info on registration; modeled partisanship has large errors in some states; party registration may lag actual identification |
Jump ahead for FAQs about political weighting, including its shortcomings.


