
The American Trends Panel survey methodology
The American Trends Panel (ATP), created by Pew Research Center, is a nationally representative panel of randomly selected U.S. adults. This report is based on interviews with respondents to nine survey waves of the panel conducted during 2020, including a post-election wave that measured turnout and vote choice in the 2020 presidential election. Panelists participate via self-administered web surveys. Panelists who do not have internet access are provided with a tablet and wireless internet connection. Interviews are conducted in both English and Spanish. The panel is managed by Ipsos.
Panel recruitment
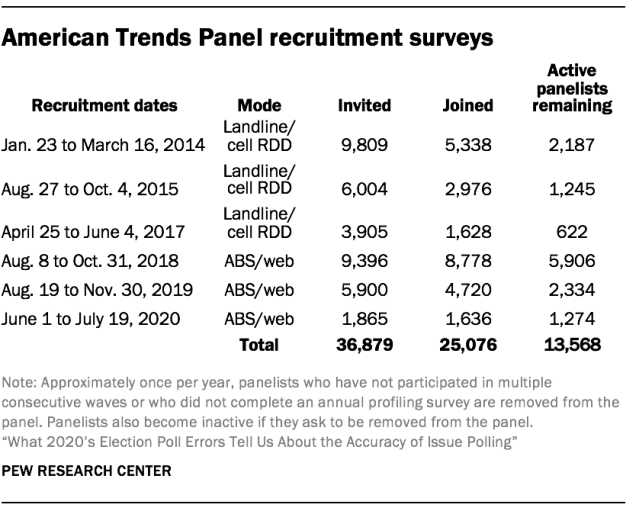
The ATP was created in 2014, with the first cohort of panelists invited to join the panel at the end of a large, national, landline and cellphone random-digit-dial survey that was conducted in both English and Spanish. Two additional recruitments were conducted using the same method in 2015 and 2017, respectively. Across these three surveys, a total of 19,718 adults were invited to join the ATP, of whom 9,942 (50%) agreed to participate.
In August 2018, the ATP switched from telephone to address-based recruitment. Invitations were sent to a random, address-based sample of households selected from the U.S. Postal Service’s Delivery Sequence File. Two additional recruitments were conducted using the same method in 2019 and 2020, respectively. Across these three address-based recruitments, a total of 17,161 adults were invited to join the ATP, of whom 15,134 (88%) agreed to join the panel and completed an initial profile survey. In each household, the adult with the next birthday was asked to go online to complete a survey, at the end of which they were invited to join the panel. Of the 25,076 individuals who have ever joined the ATP, 13,568 remained active panelists and continued to receive survey invitations at the time the most recent panel wave used in this report was conducted.
The U.S. Postal Service’s Delivery Sequence File has been estimated to cover as much as 98% of the population, although some studies suggest that the coverage could be in the low 90% range.4 The American Trends Panel never uses breakout routers or chains that direct respondents to additional surveys.
Sample design
The overall target population for this survey was non-institutionalized persons ages 18 and older, living in the U.S., including Alaska and Hawaii.
Questionnaire development and testing
The questionnaires for the surveys used here were developed by Pew Research Center in consultation with Ipsos. The web program was rigorously tested on both PC and mobile devices by the Ipsos project management team and Pew Research Center researchers. The Ipsos project management team also populated test data which was analyzed in SPSS to ensure the logic and randomizations were working as intended before launching the surveys.
Incentives
All respondents were offered a post-paid incentive for their participation. Respondents could choose to receive the post-paid incentive in the form of a check or a gift code to Amazon.com or could choose to decline the incentive. Incentive amounts ranged from $5 to $20 depending on whether the respondent belongs to a part of the population that is harder or easier to reach. Differential incentive amounts were designed to increase panel survey participation among groups that traditionally have low survey response propensities.
Waves used in this study
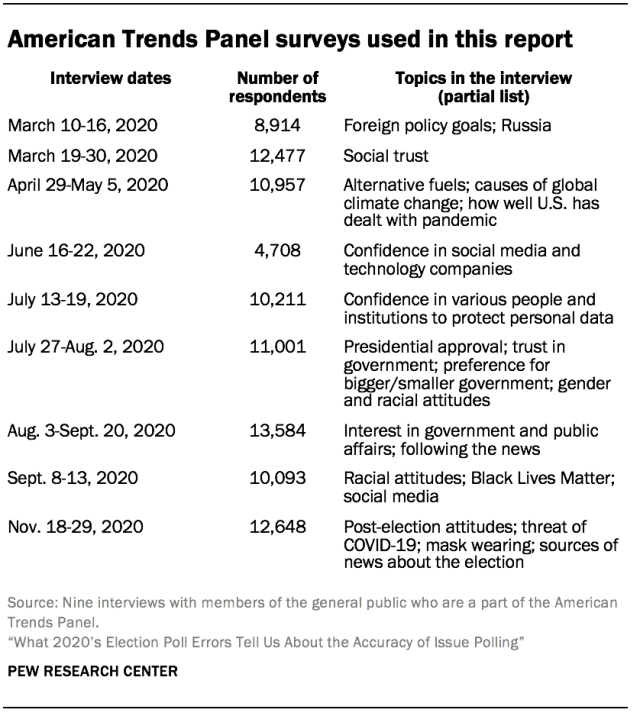
Here are the nine survey waves used in the study, with interview dates, number of respondents and a partial list of the topics included in the study.
Data quality checks
To ensure high-quality data, the Center’s researchers performed data quality checks to identify any respondents showing clear patterns of satisficing. This includes checking for very high rates of leaving questions blank, as well as always selecting the first or last answer presented. A small number of individuals were removed from each wave as a result of these checks. For additional details, please consult the methodologies for individual waves.
Weighting
Most of the data used in this study were subjected to special weighting created for the purpose of simulating two kinds of samples, one that reflected the actual division of the presidential vote at the national level, plus an evenly balanced division of Democrats and Republicans among nonvoters, and the other that reflected a large overstatement of support for Joe Biden and a 10-point Democratic advantage in party affiliation. Both special weights also adjusted the sample to match the actual share of the general public who turned out to vote.
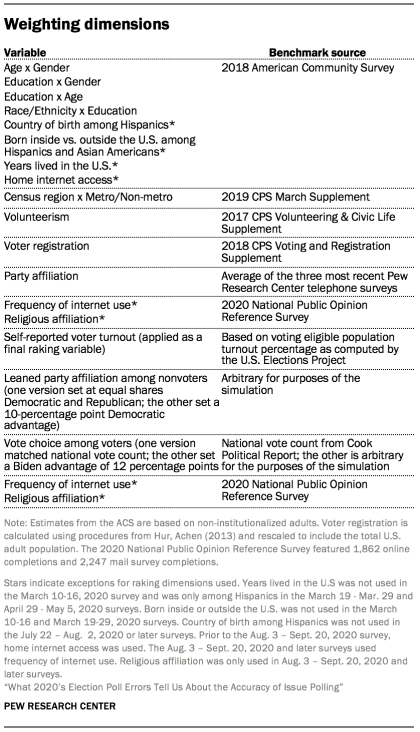
The ATP data was weighted in a multistep process that accounts for multiple stages of sampling and nonresponse that occur at different points in the survey process. First, each panelist begins with a base weight that reflects their probability of selection for their initial recruitment survey (and the probability of being invited to participate in the panel in cases where only a subsample of respondents were invited). The base weights for panelists recruited in different years are scaled to be proportionate to the effective sample size for all active panelists in their cohort. To correct for nonresponse to the initial recruitment surveys and gradual panel attrition, the base weights for all active panelists are calibrated to align with the population benchmarks identified in the accompanying table to create a full-panel weight.
For ATP waves in which only a subsample of panelists are invited to participate, a wave-specific base weight is created by adjusting the full-panel weights for subsampled panelists to account for any differential probabilities of selection for the particular panel wave. For waves in which all active panelists are invited to participate, the wave-specific base weight is identical to the full-panel weight.
The wave-specific base weights for panelists who completed the survey are again calibrated to match the population benchmarks specified above. These weights are trimmed (typically at about the 1st and 99th percentiles) to reduce the loss in precision stemming from variance in the weights.5 Sampling errors and test of statistical significance take into account the effect of weighting.
The special weighting for this study employed all of the weighting dimensions normally employed by Pew Research Center when it weights the American Trends Panel with an additional calibration to match desired dimensions for voter turnout, vote choice among voters, and party affiliation among non-voters. As the special weights use arbitrary targets for the purposes of simulation, estimates in the report should not be used to describe the U.S. population.
© Pew Research Center, 2021


