This report – a study of the news and other content on a host of alternative social media sites – uses four different research components and methodologies, including a national representative survey of U.S. adults conducted through Pew Research Center’s American Trends Panel (ATP), as well as an analysis of a selection of alternative social media sites, the prominent accounts on them, and the posts those accounts published in June 2022.
This is the latest report in Pew Research Center’s ongoing investigation of the state of news, information and journalism in the digital age, a research program funded by The Pew Charitable Trusts, with generous support from the John S. and James L. Knight Foundation.
Survey
The American Trends Panel survey methodology
Overview
The American Trends Panel (ATP), created by Pew Research Center, is a nationally representative panel of randomly selected U.S. adults. Panelists participate via self-administered web surveys. Panelists who do not have internet access at home are provided with a tablet and wireless internet connection. Interviews are conducted in both English and Spanish. The panel is being managed by Ipsos.
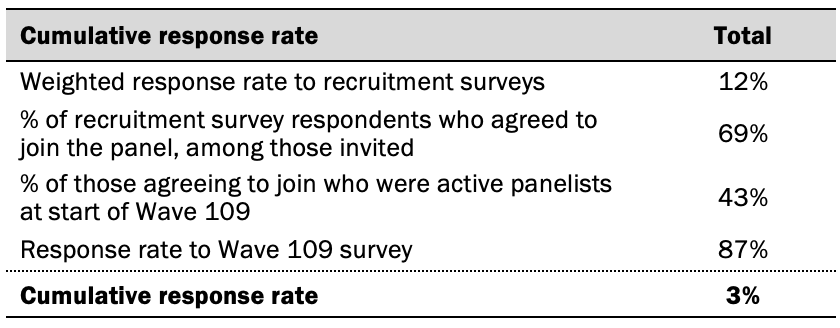
Data in this report is drawn from the panel wave conducted from May 16 to May 22, 2022. A total of 10,188 panelists responded out of 11,668 who were sampled, for a response rate of 87%. The cumulative response rate accounting for nonresponse to the recruitment surveys and attrition is 3%. The break-off rate among panelists who logged on to the survey and completed at least one item is 1%. The margin of sampling error for the full sample of 10,188 respondents is plus or minus 1.6 percentage points.
Panel recruitment
The ATP was created in 2014, with the first cohort of panelists invited to join the panel at the end of a large, national, landline and cellphone random-digit-dial survey that was conducted in both English and Spanish. Two additional recruitments were conducted using the same method in 2015 and 2017, respectively. Across these three surveys, a total of 19,718 adults were invited to join the ATP, of whom 9,942 (50%) agreed to participate.
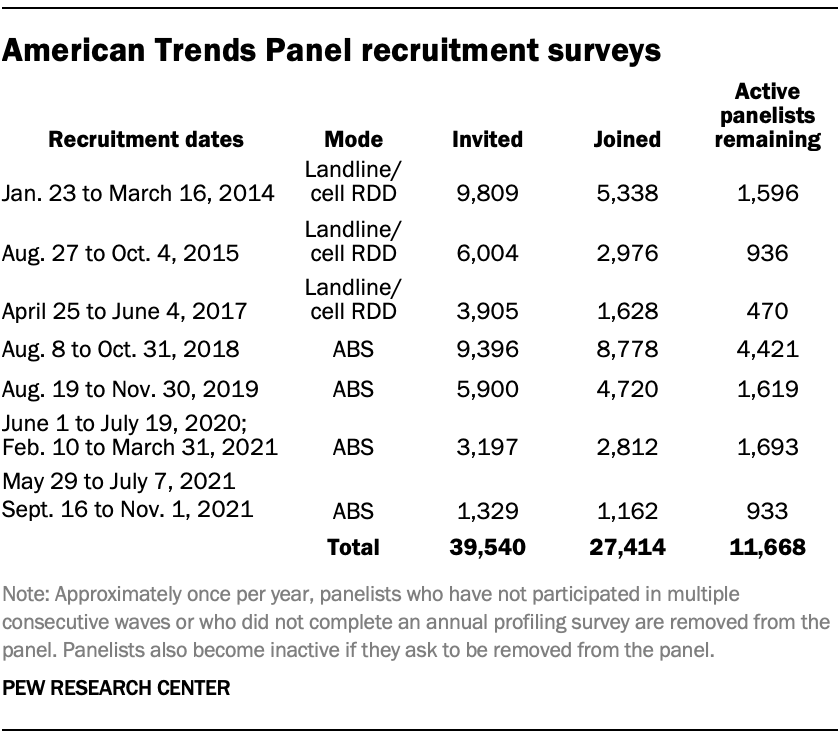
In August 2018, the ATP switched from telephone to address-based recruitment. Invitations were sent to a stratified, random sample of households selected from the U.S. Postal Service’s Delivery Sequence File. Sampled households receive mailings asking a randomly selected adult to complete a survey online. A question at the end of the survey asks if the respondent is willing to join the ATP. Starting in 2020 another stage was added to the recruitment. Households that do not respond to the online survey are sent a paper version of the questionnaire, $5 and a postage-paid return envelope. A subset of the adults returning the paper version of the survey are invited to join the ATP. This subset of adults receive a follow-up mailing with a $10 pre-incentive and invitation to join the ATP.
Across the four address-based recruitments, a total of 19,822 adults were invited to join the ATP, of whom 17,472 agreed to join the panel and completed an initial profile survey. In each household, the adult with the next birthday was asked to go online to complete a survey, at the end of which they were invited to join the panel. Of the 27,414 individuals who have ever joined the ATP, 11,668 remained active panelists and continued to receive survey invitations at the time this survey was conducted.
The U.S. Postal Service’s Delivery Sequence File has been estimated to cover as much as 98% of the population, although some studies suggest that the coverage could be in the low 90% range.8 The American Trends Panel never uses breakout routers or chains that direct respondents to additional surveys.
Sample design
The overall target population for this survey was non-institutionalized persons ages 18 and older, living in the U.S., including Alaska and Hawaii. All active panel members were invited to participate in this wave.
Questionnaire development and testing
The questionnaire was developed by Pew Research Center in consultation with Ipsos. The web program was rigorously tested on both PC and mobile devices by the Ipsos project management team and Pew Research Center researchers. The Ipsos project management team also populated test data that was analyzed in SPSS to ensure the logic and randomizations were working as intended before launching the survey.
Incentives
All respondents were offered a post-paid incentive for their participation. Respondents could choose to receive the post-paid incentive in the form of a check or a gift code to Amazon.com or could choose to decline the incentive. Incentive amounts ranged from $5 to $20 depending on whether the respondent belongs to a part of the population that is harder or easier to reach. Differential incentive amounts were designed to increase panel survey participation among groups that traditionally have low survey response propensities.
Data collection protocol
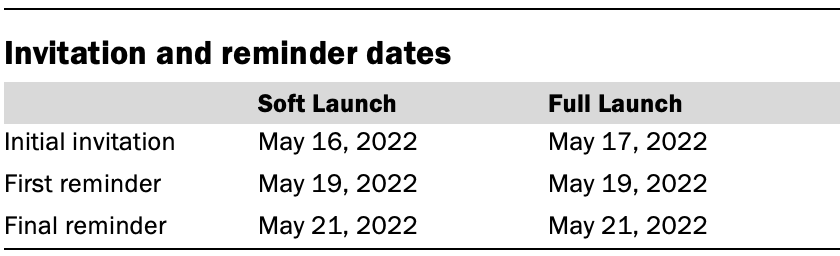
The data collection field period for this survey was May 16 to May 22, 2022. Postcard notifications were mailed to all ATP panelists with a known residential address on May 16.
Invitations were sent out in two separate launches: Soft Launch and Full Launch. Sixty panelists were included in the soft launch, which began with an initial invitation sent on May 16. The ATP panelists chosen for the initial soft launch were known responders who had completed previous ATP surveys within one day of receiving their invitation. All remaining English- and Spanish-speaking panelists were included in the full launch and were sent an invitation on May 17.
All panelists with an email address received an email invitation and up to two email reminders if they did not respond to the survey. All ATP panelists that consented to SMS messages received an SMS invitation and up to two SMS reminders.
Data quality checks
To ensure high-quality data, the Center’s researchers performed data quality checks to identify any respondents showing clear patterns of satisficing. This includes checking for very high rates of leaving questions blank, as well as always selecting the first or last answer presented. As a result of this checking, three ATP respondents were removed from the survey dataset prior to weighting and analysis.
Weighting
The ATP data is weighted in a multistep process that accounts for multiple stages of sampling and nonresponse that occur at different points in the survey process. First, each panelist begins with a base weight that reflects their probability of selection for their initial recruitment survey. The base weights for panelists recruited in different years are scaled to be proportionate to the effective sample size for all active panelists in their cohort and then calibrated to align with the population benchmarks in the accompanying table to correct for nonresponse to recruitment surveys and panel attrition. If only a subsample of panelists was invited to participate in the wave, this weight is adjusted to account for any differential probabilities of selection.
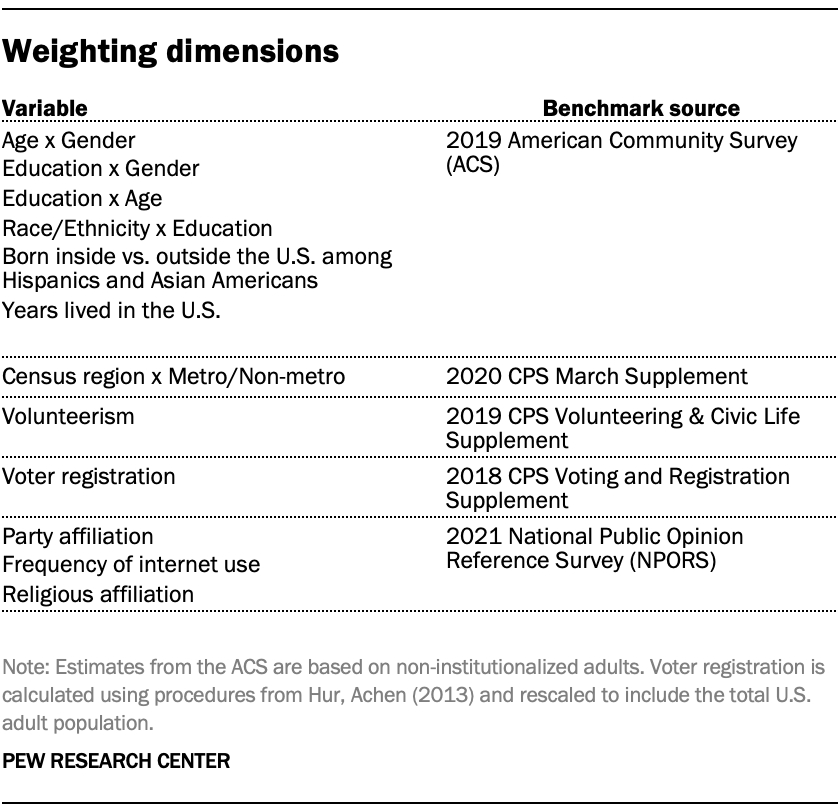
Among the panelists who completed the survey, this weight is then calibrated again to align with the population benchmarks identified in the accompanying table and trimmed at the 1st and 99th percentiles to reduce the loss in precision stemming from variance in the weights. Sampling errors and tests of statistical significance take into account the effect of weighting.
Some of the population benchmarks used for weighting come from surveys conducted prior to the coronavirus outbreak that began in February 2020. However, the weighting variables for panelists recruited in 2021 were measured at the time they were recruited to the panel. Likewise, the profile variables for existing panelists were updated from panel surveys conducted in July or August 2021.
This does not pose a problem for most of the variables used in the weighting, which are quite stable at both the population and individual levels. However, volunteerism may have changed over the intervening period in ways that made their 2021 measurements incompatible with the available (pre-pandemic) benchmarks. To address this, volunteerism is weighted using the profile variables that were measured in 2020. For all other weighting dimensions, the more recent panelist measurements from 2021 are used.
For panelists recruited in 2021, plausible values were imputed using the 2020 volunteerism values from existing panelists with similar characteristics. This ensures that any patterns of change that were observed in the existing panelists were also reflected in the new recruits when the weighting was performed.
The following table shows the unweighted sample sizes and the error attributable to sampling that would be expected at the 95% level of confidence for different groups in the survey.
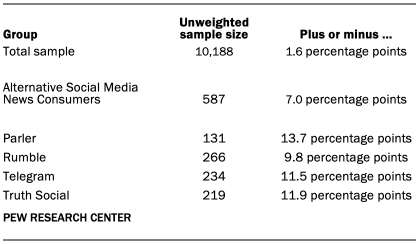
Sample sizes and sampling errors for other subgroups are available upon request. In addition to sampling error, one should bear in mind that question wording and practical difficulties in conducting surveys can introduce error or bias into the findings of opinion polls.
Dispositions and response rates

Content analysis of alternative social media sites
Overview
To better understand the news and other content people are exposed to on alternative social media sites, researchers first conducted an audit of each of seven social media sites that are emerging as alternatives to larger, more established sites – BitChute, Gab, Gettr, Parler, Rumble, Telegram and Truth Social. The audit looked at site features, philosophy and other characteristics.
Site selection
Sites were selected after canvassing media and academic articles and social media posts about alternative social media sites. Sites were included in the audit if they had publicly accessible posts, were mentioned in news media, and had at least 500,000 unique visitors in December 2021 according to ComScore. There were two additions to this list, based on their prominence in news media coverage: Gab was included despite not being tracked by ComScore because a Gab user charged in a 2018 mass shooting at a Pittsburgh synagogue was widely discussed in the news media; and Truth Social had not yet launched to the public in 2021, but was expected to receive wide attention due to former President Trump’s involvement.
This process led to the selection of seven sites to be audited. Those seven sites were:
- BitChute
- Gab
- Gettr
- Parler
- Rumble
- Telegram
- Truth Social
Audit of seven alternative social media sites
Once these seven sites were selected, researchers conducted an analysis of key characteristics of each site. This audit analysis investigated the general structure, philosophy, and availability of each site, its funding, and key components of the user experience, such as how to interact with other accounts and posts and privacy settings.
A team of analysts were trained on each variable through an analysis of real-world examples. After internal agreement was reached on how to evaluate each variable, each site was coded by two researchers in April 2022, with any disagreements discussed between the coders and lead researcher. A researcher then reviewed these findings in August-September 2022.
Content analysis of alternative social media site accounts
Account collection
Once sites were audited, researchers set out to draw a sample of prominent accounts from each site. However, like other social media sites, there is no definitive list of accounts for each site. To discover the most prominent accounts, researchers observed each site’s own lists of trending posts (where available) twice daily from June 6 to 13, 2022, using a custom Python script. This resulted in a list of accounts whose posts had received attention, but not necessarily those that had the most followers. This was partially addressed by collecting information on accounts that were suggested by the site on a twice daily basis during the same time period, where available. But to be as inclusive as possible in the user list, researchers used custom Python scripts to collect information on accounts followed by each account collected above, where available. Combined, these methods collected thousands of accounts for each site (see details below). Posts were collected using the site’s Application Programming Interface (API), where available, or the HTML of the page itself where no API was available (BitChute and Rumble).
There were a few exceptions to this method.
Telegram started as a chat app and built public channels on top of that infrastructure; it does not have a list of trending posts or official directory of popular channels. Instead, researchers used two methods to create a seed list of Telegram channels. First, researchers examined popular directories of Telegram channels, including tlgrm.eu, telegramchannels.me, tgstat.com, and tgdr.io, for channels in the news or politics directories that primarily posted in English. Second, researchers collected channels from media coverage of Telegram and academic researchers that focus on this site. This resulted in a list of 7,853 unique channels. For each channel, researchers used a custom Python script to collect the last 500 posts as of late June 2022. If a post was reposted from another channel, that new channel was added to the list of channels that could be sampled.
Accounts were collected during the early months of Truth Social’s availability to the public, and some features, such as the trending post section, did not regularly update. In addition to the list of suggested users – which also did not update very frequently – and the trending posts, researchers used a custom Python script to twice daily collect the 1,000 most recent posts that used each of the trending hashtags (as listed in a section on the site), and then collected the list of accounts these accounts followed using the process outlined above.
On BitChute and Rumble, channels can have followers (called subscribers on these sites), but there is no public list of any channels they may follow. Accordingly, researchers did not collect the following lists for these sites and relied entirely on the lists of trending posts.
The total number of accounts collected from each site was:
- BitChute – 432 accounts
- Gab – 152,820
- Gettr – 83,074
- Parler – 32,084
- Rumble – 550
- Telegram – 20,257
- Truth Social – 357,596
The varying number of accounts found on each site is not reflective of the popularity of any individual site but rather the different methods in which these accounts were discovered.
Account sampling and analysis
Researchers then drew a sample of 200 of the most prominent accounts – those with the highest number of followers or subscribers – on each site. Sampling was done on a per-site basis to account for the different size of each site’s user base. This sample included 1,400 sampled accounts, which were coded for key characteristics by a team of human coders.
For most sites, the sampling frame is the top 5% of accounts by follower count. A systematic sample of accounts was then drawn using an interval sampling method. To do so, researchers first sorted the list of accounts in each site’s sampling frame by follower count. Researchers then determined the selection interval by dividing the number of accounts in the sampling frame by 200; accordingly, sites with larger sampling frames had a larger interval between selections.
For BitChute and Rumble, the number of accounts in the top 5% of accounts was fewer than 200, so the 200 most-followed accounts from each of these sites were used as the sample.
Before coding, any accounts that were not in English or were inactive (had not posted since May of 2021) were excluded. For most sites, each inactive or foreign language account was replaced with the account with the closest follower count. For BitChute and Rumble, these accounts were replaced with the account with the highest number of followers that had not yet been sampled.
Once the sample was drawn, a team of coders was trained on a set of variables that analyzed key characteristics of each account. Only the account profile, including description, bio, pinned posts, and banner image were included in this analysis (except for accounts on Rumble, the only site that does not provide space for a bio section; coders instead examined the text descriptions of the first five videos for bio information). Additionally, many accounts included a link to an external link page, such as linktr.ee, to link to their other online accounts; the links found there were included as well. Before training, researchers developed codes for each variable through an iterative process that identified common characteristics and reduced overlap between codes, where possible. Coders were then trained on these variables through an examination of popular accounts from each site – not necessarily accounts in the sample.
Intercoder agreement was tested using Fleiss’s Kappa on all variables that required judgement on the part of the coder. The mean Kappa across these variables was 0.75, with a minimum of 0.67 (account type) and a max of 0.86 (self-described political orientation).
Below are the main measures and their Kappas (minimum and average reported for variables with multiple, non-exclusive options, like select-alls):
- Account type: 0.67
- Affiliation: 0.68
- Self-described political orientation: 0.86
- Value/identity appeals: 0.50 or higher (average is 0.80)
Content analysis of posts from prominent alternative social media accounts
Posts analysis
Researchers then used a set of Python scripts to collect all posts published by these 1,400 accounts in June 2022. A total of 1,147 accounts published at least one post during that time period, ranging from 105 on Parler to 199 on BitChute. The total number of posts collected was 585,470.
The text of each post, including the original text of the post and the title, link, and description of any embedded links was included in the analysis. No videos or other content was included in this analysis. For the two video-focused sites – BitChute and Rumble – researchers examined the text descriptions of each post and performed pre-processing on these posts to exclude biographic or promotional text that was duplicated across posts.
To determine the rate at which prominent topics were discussed, researchers first identified five key topics based on the combination of prevalent issues on the news during the month and common themes discovered in exploring the data. The topics included are abortion; guns, gun control and shootings; the Jan. 6, 2021, attack on the U.S. Capitol (and related hearings); LGBTQ issues; and vaccines.
Researchers then used an iterative process to develop a list of keywords that would identify posts about each topic (a single post could be about multiple topics). First, researchers created an initial set of keywords and identified posts that matched these criteria. Researchers then randomly sampled 1% of all posts collected from each site (0.5% in the case of Telegram due to the large volume and conversational nature of the posts on the platform). A team of four human coders then examined each post and determined if it was about the identified topic or not. Overall, human coders agreed with the keyword identification 99% of the time. In cases where there was disagreement between the keyword-identification process and the human coders, researchers adjusted the keywords and tested the effects of this modification with the coders. Once this process was concluded, a smaller set of posts (188) was used to calculate agreement between coders and the keyword identification. The final keywords9 and Krippendorf’s alpha are:
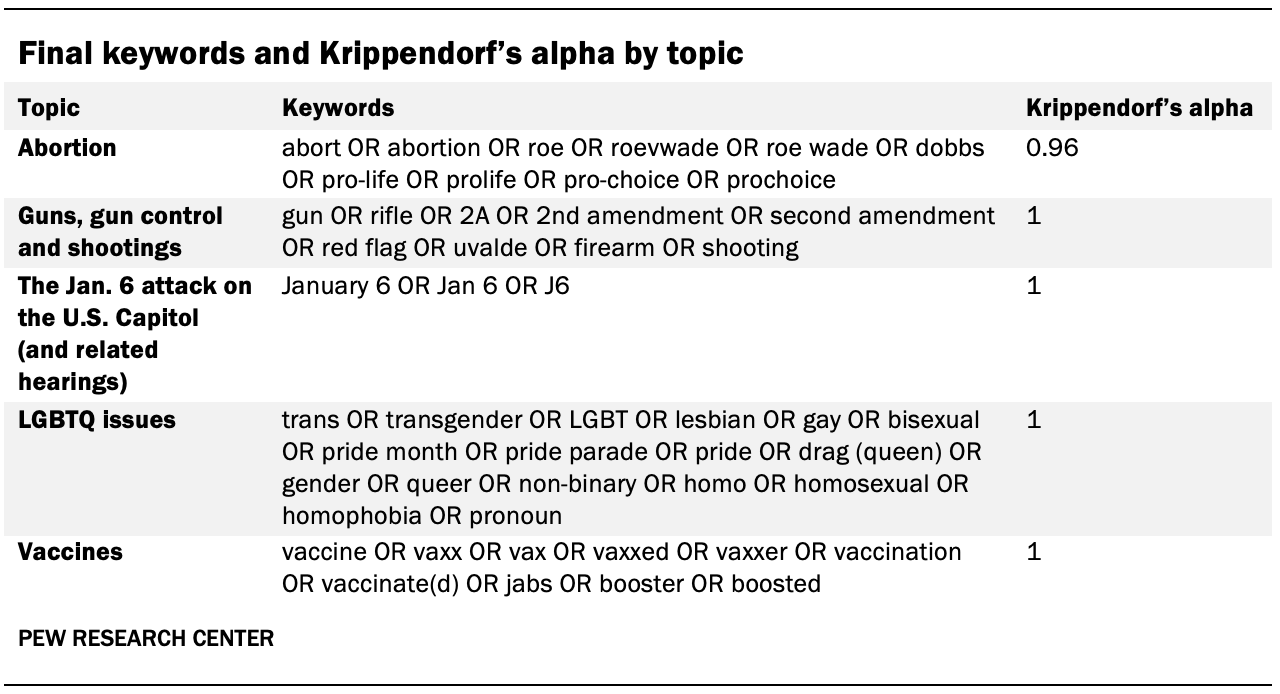
Once researchers identified posts that were relevant to each topic, they examined the occurrence of unique phrases related to the topic in these posts. Before examining these phrases, common filler words – such as a, an or the – and the initial keywords that were being used to identify topic posts were removed. Where possible, common terms in the English language were standardized to their base form (i.e., “felt” to “feel,” “miles” to “mile,” etc.). Researchers then identified the 50 most common unique bi- and tri-grams – two- or three-word phrases – per topic (unigrams – one-word phrases – were excluded after testing showed that that the results often were not meaningful with the exception of the LGBTQ topic). Duplicated phrases that were associated with lower mentions (e.g., “pregnancy center” instead of “crisis pregnancy center”) and filler phrases that bore no relation to the content of the text (e.g., “June 2022 [update]”) were then removed. The final list of top 15 phrases on each platform is included in Appendix C.
Researchers then examined the links in every post from June 2022 (a post may include more than one link). For each link, researchers extracted the domain – e.g., pewresearch.org – and tallied the number of links that pointed to each domain. Shortened links – such as to bit.ly – were expanded where possible. About a quarter (27%) of posts included at least one link, for 359,037 discrete links to 9,075 unique domains.
All domains with at least 100 links were included in the analysis of domain type. This led to a total of 345 domains, accounting for 84% of all links.
These domains were then categorized using a similar schema as a 2020 study that examined sources in Facebook posts about COVID-19. All original coding from that study was imported, and one of the original coders from that study examined those codes and coded any new domains that were not found in that study. Domains that were difficult to code were discussed among the group, and a second researcher reviewed all new coding.