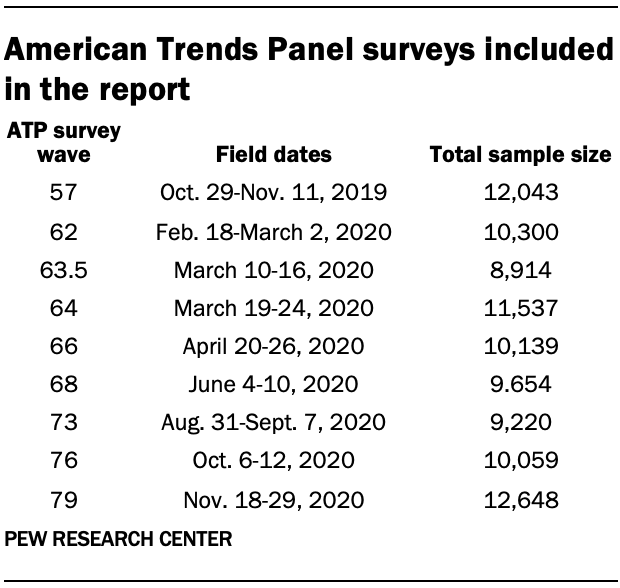
The data used in this report was collected from nine surveys conducted between November 2019 and November 2020 on Pew Research Center’s American Trends Panel (ATP). The surveys were all a part of the Center’s American News Pathways project, in which the same 12,043 panelists were surveyed repeatedly between November 2019 and November 2020 on topics related to their news consumption habits.
About the American Trends Panel
The American Trends Panel (ATP), created by Pew Research Center, is a nationally representative panel of randomly selected U.S. adults. Panelists participate via self-administered web surveys. Panelists who do not have internet access at home are provided with a tablet and wireless internet connection. Interviews are conducted in both English and Spanish. The panel is being managed by Ipsos.
Details about data collection, sample design and specific response rates for each wave can be found in the individual methodologies for each wave:
- Wave 57 methodology
- Wave 62 methodology
- Wave 63.5 methodology
- Wave 64 methodology
- Wave 66 methodology
- Wave 68 methodology
- Wave 73 methodology
- Wave 76 methodology
- Wave 79 methodology
Panel recruitment
The ATP was created in 2014, with the first cohort of panelists invited to join the panel at the end of a large, national, landline and cellphone random-digit-dial survey that was conducted in both English and Spanish. Two additional recruitments were conducted using the same method in 2015 and 2017, respectively. Across these three surveys, a total of 19,718 adults were invited to join the ATP, of whom 9,942 (50%) agreed to participate.
In August 2018, the ATP switched from telephone to address-based recruitment. Invitations were sent to a random, address-based sample of households selected from the U.S. Postal Service’s Delivery Sequence File. Two additional recruitments were conducted using the same method in 2019 and 2020, respectively. Across these three address-based recruitments, a total of 17,161 adults were invited to join the ATP, of whom 15,134 (88%) agreed to join the panel and completed an initial profile survey. In each household, the adult with the next birthday was asked to go online to complete a survey, at the end of which they were invited to join the panel. Of the 25,076 individuals who have ever joined the ATP, 13,568 remained active panelists and continued to receive survey invitations at the time this survey was conducted.
The U.S. Postal Service’s Delivery Sequence File has been estimated to cover as much as 98% of the population, although some studies suggest that the coverage could be in the low 90% range.1 The American Trends Panel never uses breakout routers or chains that direct respondents to additional surveys.
Weighting
For the analysis of Republicans and Republican-leaning independents who relied most on Donald Trump and the White House coronavirus task force for news about COVID-19, custom weights were created for the subset of panelists who participated in each wave. New weights were created for the five pairs of surveys that were analyzed using that question. To ensure consistency across waves for panelists’ demographics, analysis of panelists who responded to both Wave 66 and Wave 68 was additionally restricted to those who remained active panelists as of Wave 72.
For the analysis of media diets across the November 2019, September 2020 and November 2020 surveys, a custom weight was created for the subset of panelists who participated in all three waves. These weights used the population benchmarks listed in the accompanying table. For details about how individual waves were weighted, refer to the full methodologies linked above.
These weights are trimmed (typically at about the 1st and 99th percentiles) to reduce the loss in precision stemming from variance in the weights. Sampling errors and tests of statistical significance take into account the effect of weighting.
Specific weighting design and parameters for the individual panel waves can be found in each wave’s methodology.
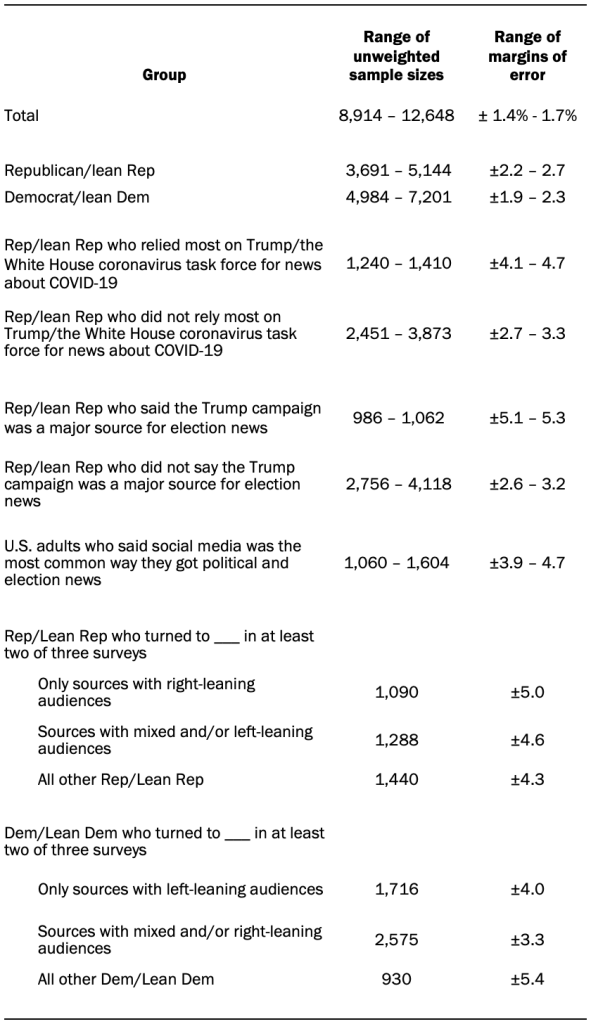
The following table shows the unweighted sample sizes and the error attributable to sampling that would be expected at the 95% level of confidence for different groups in the survey:
Sample sizes and sampling errors for other subgroups are available upon request.