
American Trends Panel November 2020 survey methodology
Overview
The American Trends Panel (ATP), created by Pew Research Center, is a nationally representative panel of randomly selected U.S. adults. Panelists participate via self-administered web surveys. Panelists who do not have internet access at home are provided with a tablet and wireless internet connection. Interviews are conducted in both English and Spanish. The panel is being managed by Ipsos.
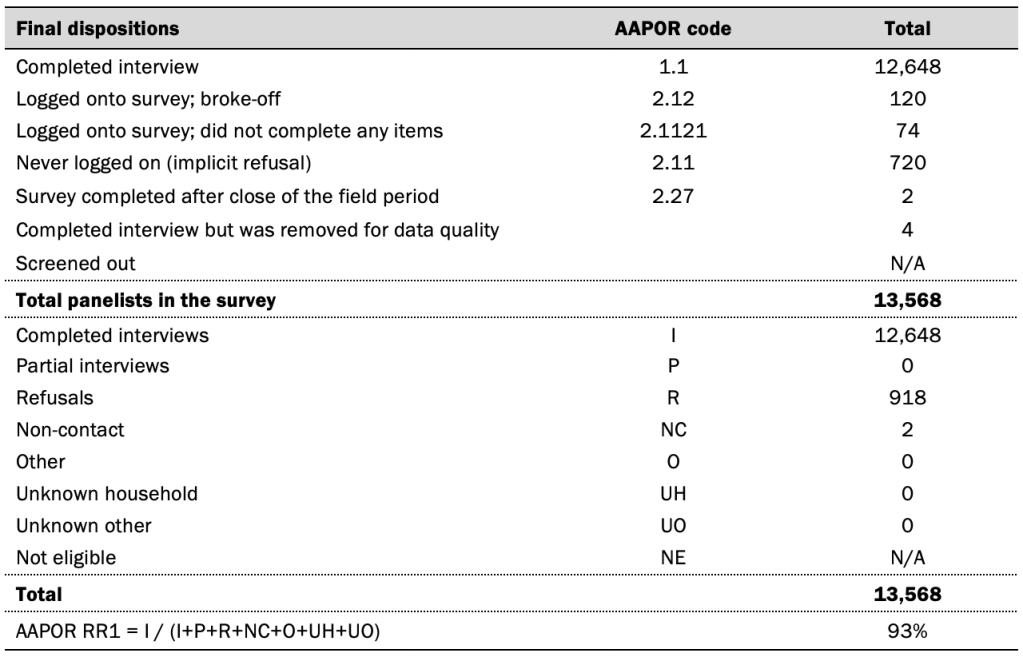
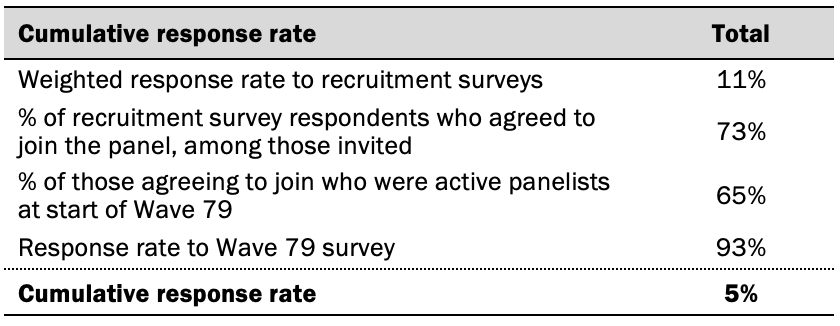
Data in this report is drawn from the panel wave conducted Nov. 18 to Nov. 29, 2020. A total of 12,648 panelists responded out of 13,568 who were sampled, for a response rate of 93%. This does not include four panelists who were removed from the data due to extremely high rates of refusal or straightlining. The cumulative response rate accounting for nonresponse to the recruitment surveys and attrition is 5%. The break-off rate among panelists who logged on to the survey and completed at least one item is 1%. The margin of sampling error for the full sample of 12,648 respondents is plus or minus 1.5 percentage points.
Panel recruitment
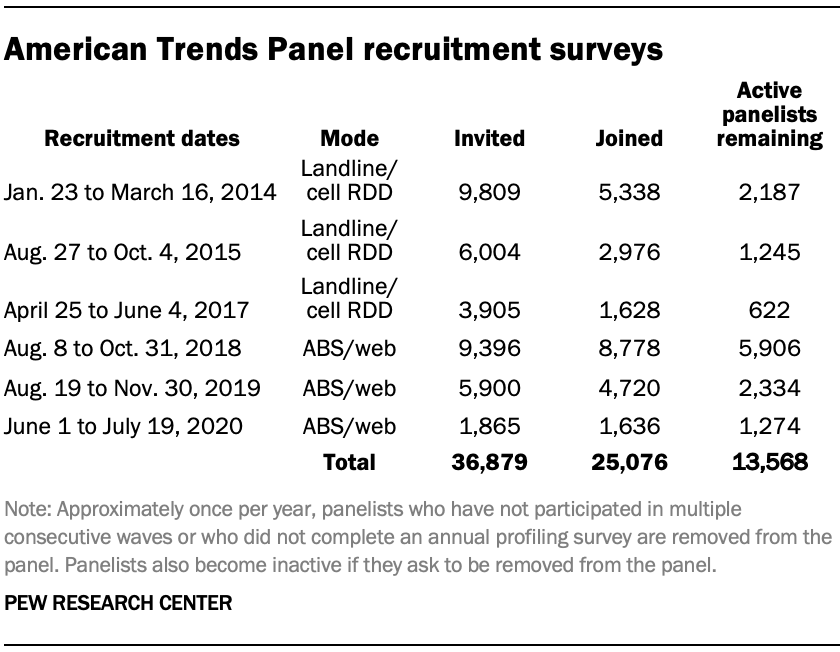
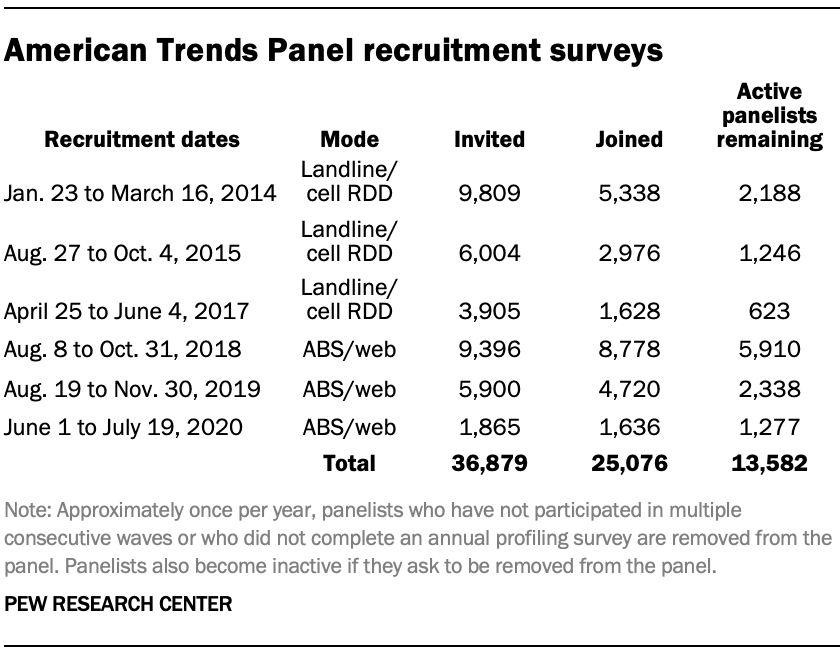
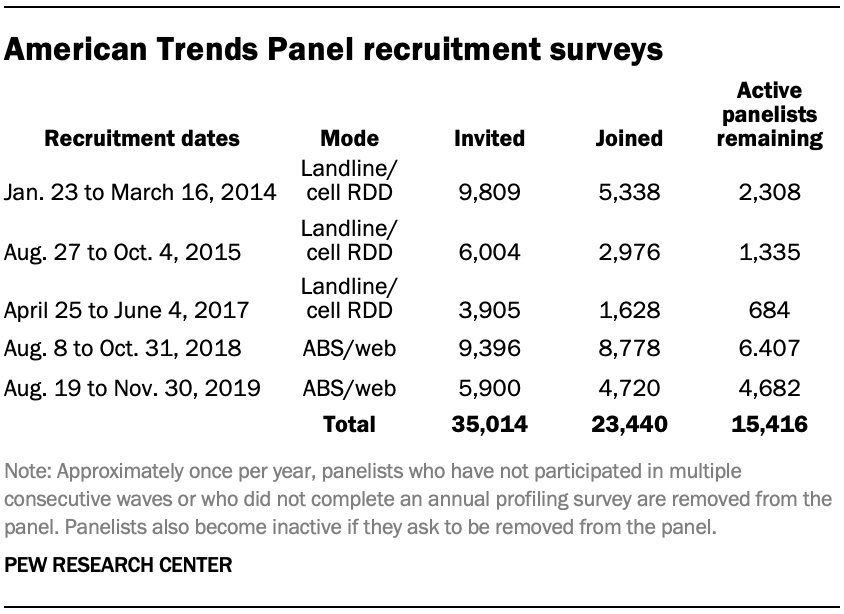
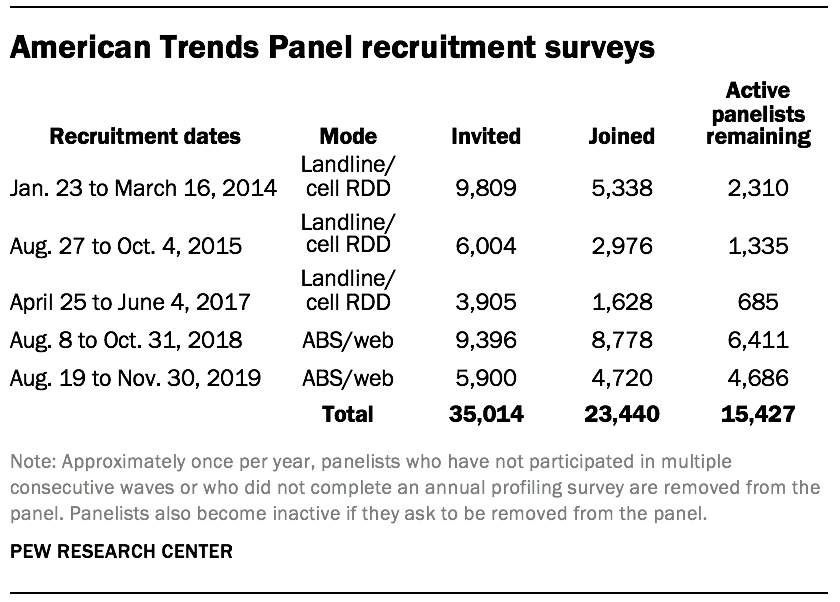
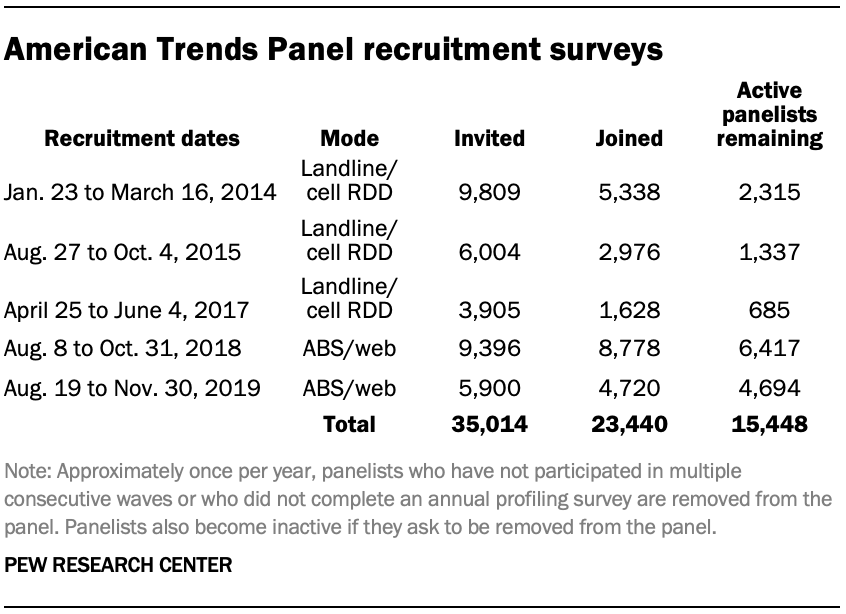
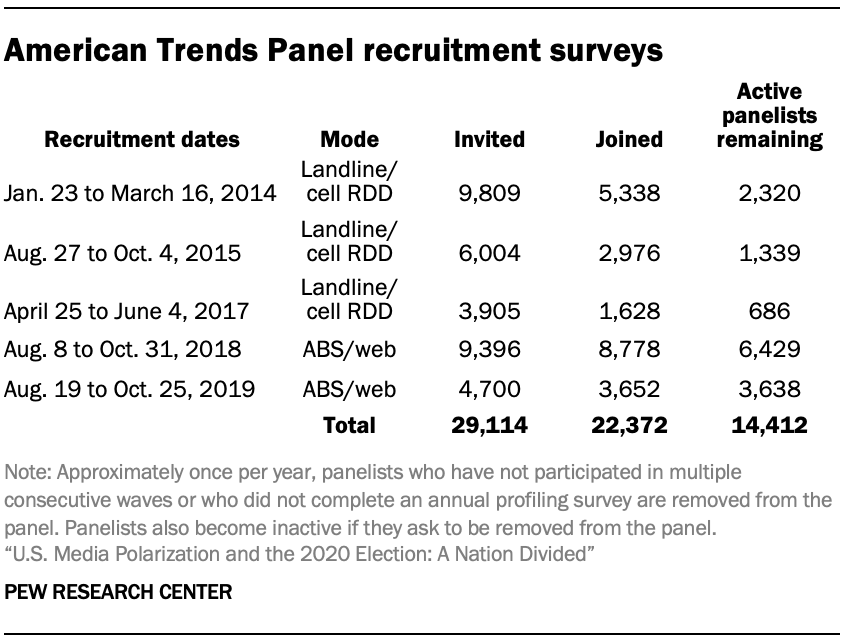
The ATP was created in 2014, with the first cohort of panelists invited to join the panel at the end of a large, national, landline and cellphone random-digit-dial survey that was conducted in both English and Spanish. Two additional recruitments were conducted using the same method in 2015 and 2017, respectively. Across these three surveys, a total of 19,718 adults were invited to join the ATP, of whom 9,942 (50%) agreed to participate.
In August 2018, the ATP switched from telephone to address-based recruitment. Invitations were sent to a random, address-based sample of households selected from the U.S. Postal Service’s Delivery Sequence File. Two additional recruitments were conducted using the same method in 2019 and 2020, respectively. Across these three address-based recruitments, a total of 17,161 adults were invited to join the ATP, of whom 15,134 (88%) agreed to join the panel and completed an initial profile survey. In each household, the adult with the next birthday was asked to go online to complete a survey, at the end of which they were invited to join the panel. Of the 25,076 individuals who have ever joined the ATP, 13,568 remained active panelists and continued to receive survey invitations at the time this survey was conducted.
The U.S. Postal Service’s Delivery Sequence File has been estimated to cover as much as 98% of the population, although some studies suggest that the coverage could be in the low 90% range.1 The American Trends Panel never uses breakout routers or chains that direct respondents to additional surveys.
Sample design
The overall target population for this survey was non-institutionalized persons ages 18 and older, living in the U.S., including Alaska and Hawaii.
Questionnaire development and testing
The questionnaire was developed by Pew Research Center in consultation with Ipsos. The web program was rigorously tested on both PC and mobile devices by the Ipsos project management team and Pew Research Center researchers. The Ipsos project management team also populated test data which was analyzed in SPSS to ensure the logic and randomizations were working as intended before launching the survey.
Incentives
All respondents were offered a post-paid incentive for their participation. Respondents could choose to receive the post-paid incentive in the form of a check or a gift code to Amazon.com or could choose to decline the incentive. Incentive amounts ranged from $5 to $20 depending on whether the respondent belongs to a part of the population that is harder or easier to reach. Differential incentive amounts were designed to increase panel survey participation among groups that traditionally have low survey response propensities.
Data collection protocol
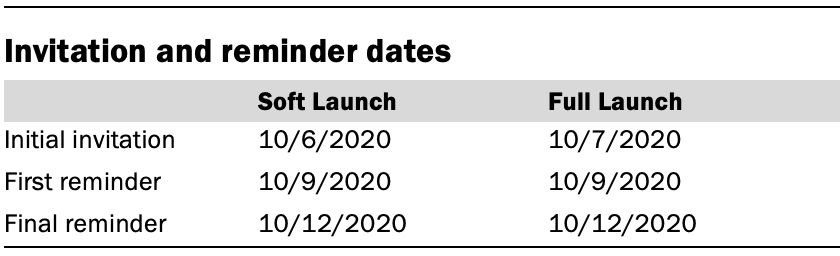
The data collection field period for this survey was Nov. 18 to Nov. 29, 2020. Postcard notifications were mailed to all ATP panelists with a known residential address on Nov. 18, 2020.
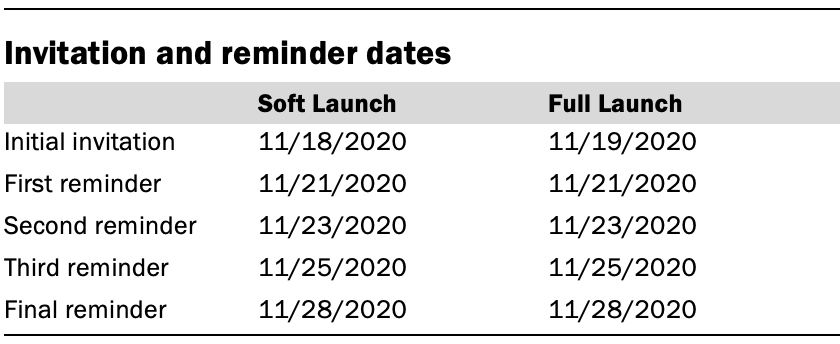
On Nov. 18 and Nov. 19, invitations were sent out in two separate launches: Soft Launch and Full Launch. Sixty panelists were included in the soft launch, which began with an initial invitation sent on Nov. 18, 2020. The ATP panelists chosen for the initial soft launch were known responders who had completed previous ATP surveys within one day of receiving their invitation. All remaining English- and Spanish-speaking panelists were included in the full launch and were sent an invitation on Nov. 19, 2020.
All panelists with an email address received an email invitation and up to four email reminders if they did not respond to the survey. All ATP panelists that consented to SMS messages received an SMS invitation and up to four SMS reminders.
Data quality checks
To ensure high-quality data, the Center’s researchers performed data quality checks to identify any respondents showing clear patterns of satisficing. This includes checking for very high rates of leaving questions blank, as well as always selecting the first or last answer presented. As a result of this checking, four ATP respondents were removed from the survey dataset prior to weighting and analysis.
Weighting
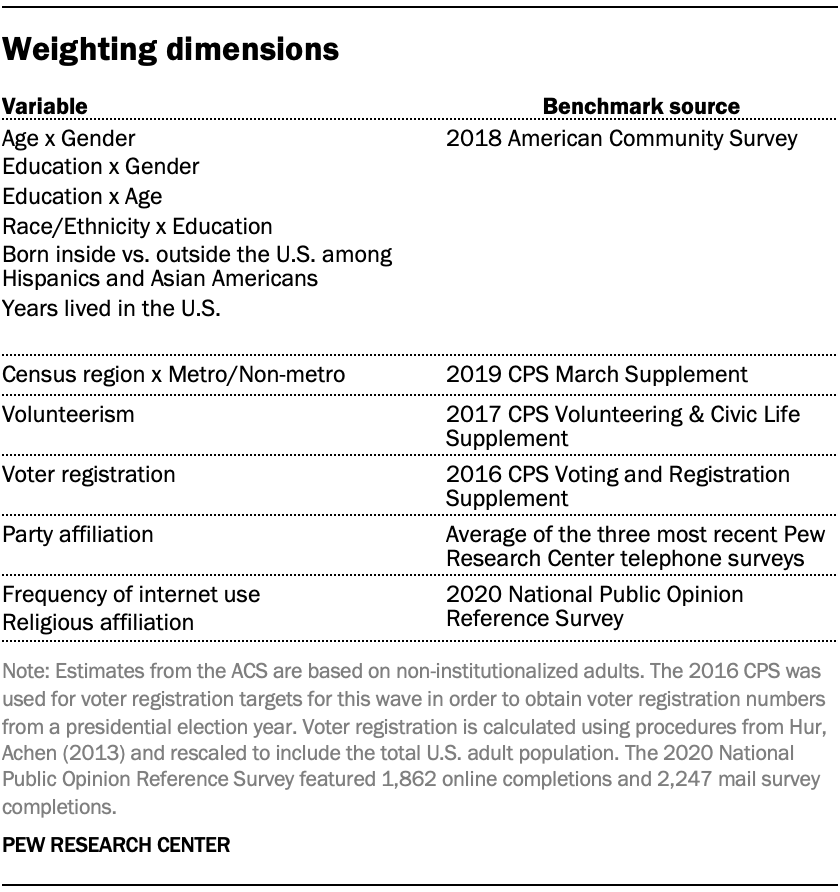
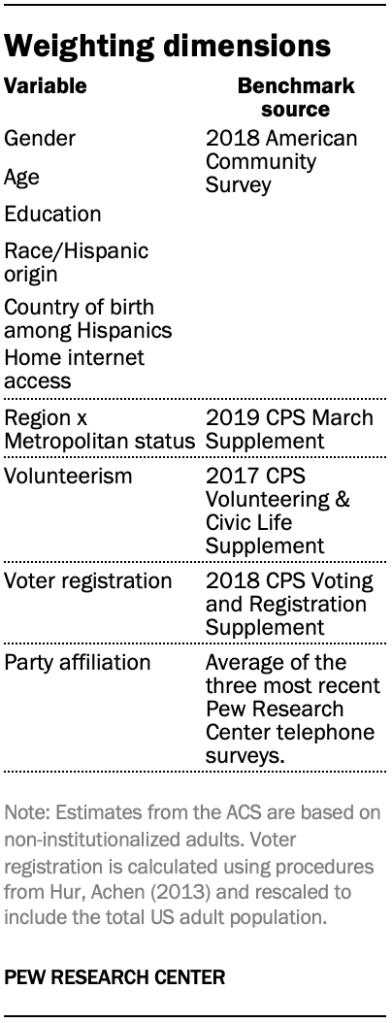
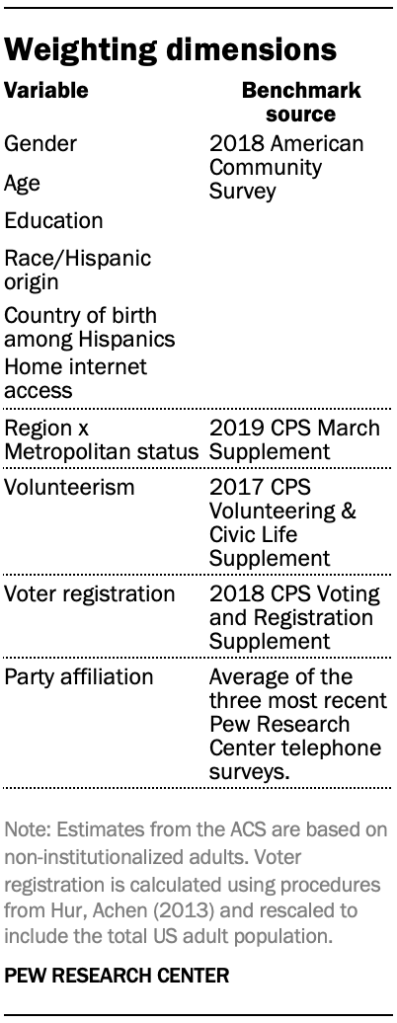
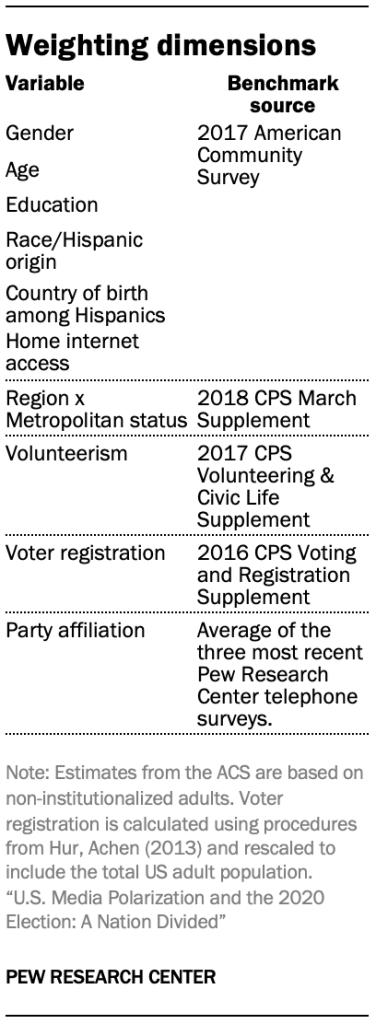
The ATP data was weighted in a multistep process that accounts for multiple stages of sampling and nonresponse that occur at different points in the survey process. First, each panelist begins with a base weight that reflects their probability of selection for their initial recruitment survey (and the probability of being invited to participate in the panel in cases where only a subsample of respondents were invited). The base weights for panelists recruited in different years are scaled to be proportionate to the effective sample size for all active panelists in their cohort. To correct for nonresponse to the initial recruitment surveys and gradual panel attrition, the base weights for all active panelists are calibrated to align with the population benchmarks identified in the accompanying table to create a full-panel weight.
For ATP waves in which only a subsample of panelists are invited to participate, a wave-specific base weight is created by adjusting the full-panel weights for subsampled panelists to account for any differential probabilities of selection for the particular panel wave. For waves in which all active panelists are invited to participate, the wave-specific base weight is identical to the full-panel weight.
In the final weighting step, the wave-specific base weights for panelists who completed the survey are again calibrated to match the population benchmarks specified above. These weights are trimmed (typically at about the 1st and 99th percentiles) to reduce the loss in precision stemming from variance in the weights. Sampling errors and test of statistical significance take into account the effect of weighting.
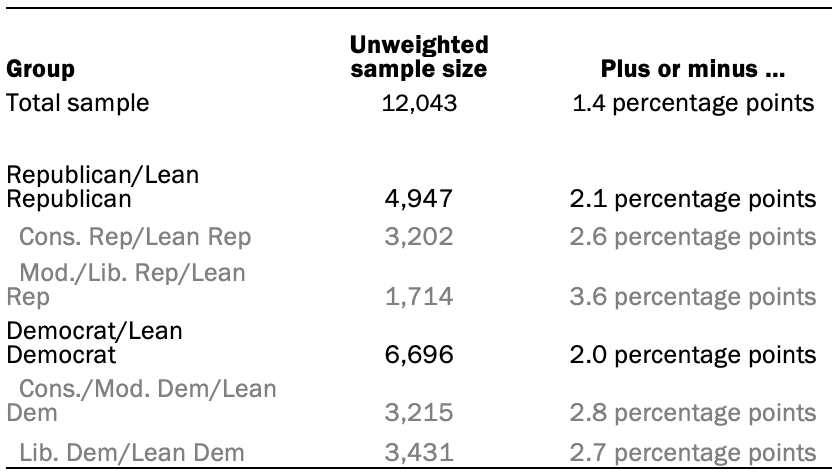
The following table shows the unweighted sample sizes and the error attributable to sampling that would be expected at the 95% level of confidence for different groups in the survey.
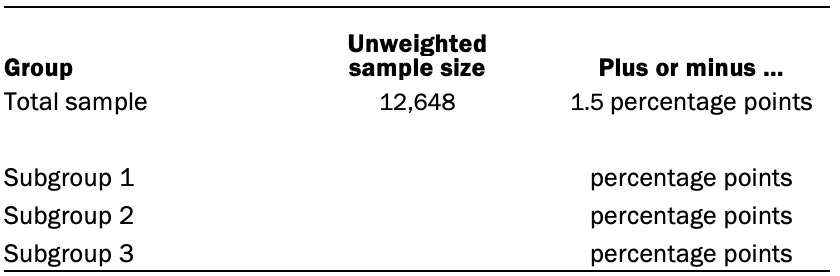
Sample sizes and sampling errors for other subgroups are available upon request. In addition to sampling error, one should bear in mind that question wording and practical difficulties in conducting surveys can introduce error or bias into the findings of opinion polls.
Dispositions and response rates
© Pew Research Center, 2020
American Trends Panel October 2020 survey methodology
Overview
The American Trends Panel (ATP), created by Pew Research Center, is a nationally representative panel of randomly selected U.S. adults. Panelists participate via self-administered web surveys. Panelists who do not have internet access at home are provided with a tablet and wireless internet connection. Interviews are conducted in both English and Spanish. The panel is being managed by Ipsos.
Data in this report is drawn from the panel wave conducted Oct. 6 to Oct. 12, 2020. A total of 10,059 panelists responded out of 10,915 who were sampled, for a response rate of 92%. This does not include nine panelists who were removed from the data due to extremely high rates of refusal or straightlining. The cumulative response rate accounting for nonresponse to the recruitment surveys and attrition is 5%. The break-off rate among panelists who logged on to the survey and completed at least one item is 1%. The margin of sampling error for the full sample of 10,059 respondents is plus or minus 1.7 percentage points.
Panel recruitment
The ATP was created in 2014, with the first cohort of panelists invited to join the panel at the end of a large, national, landline and cellphone random-digit-dial survey that was conducted in both English and Spanish. Two additional recruitments were conducted using the same method in 2015 and 2017, respectively. Across these three surveys, a total of 19,718 adults were invited to join the ATP, of whom 9,942 (50%) agreed to participate.
In August 2018, the ATP switched from telephone to address-based recruitment. Invitations were sent to a random, address-based sample of households selected from the U.S. Postal Service’s Delivery Sequence File. Two additional recruitments were conducted using the same method in 2019 and 2020, respectively. Across these three address-based recruitments, a total of 17,161 adults were invited to join the ATP, of whom 15,134 (88%) agreed to join the panel and completed an initial profile survey. In each household, the adult with the next birthday was asked to go online to complete a survey, at the end of which they were invited to join the panel. Of the 25,076 individuals who have ever joined the ATP, 13,582 remained active panelists and continued to receive survey invitations at the time this survey was conducted.
The U.S. Postal Service’s Delivery Sequence File has been estimated to cover as much as 98% of the population, although some studies suggest that the coverage could be in the low 90% range.2 The American Trends Panel never uses breakout routers or chains that direct respondents to additional surveys.
Sample design
The subsample from the ATP consisted of 10,915 ATP members who responded to the Wave 57 survey and were still active.
Questionnaire development and testing
The questionnaire was developed by Pew Research Center in consultation with Ipsos. The web program was rigorously tested on both PC and mobile devices by the Ipsos project management team and Pew Research Center researchers. The Ipsos project management team also populated test data which was analyzed in SPSS to ensure the logic and randomizations were working as intended before launching the survey.
Incentives
All respondents were offered a post-paid incentive for their participation. Respondents could choose to receive the post-paid incentive in the form of a check or a gift code to Amazon.com or could choose to decline the incentive. Incentive amounts ranged from $5 to $15 depending on whether the respondent belongs to a part of the population that is harder or easier to reach. Differential incentive amounts were designed to increase panel survey participation among groups that traditionally have low survey response propensities.
Data collection protocol
The data collection field period for this survey was Oct. 6 to Oct. 12, 2020. Postcard notifications were mailed to all ATP panelists with a known residential address on Oct. 6, 2020.
On Oct. 6 and Oct. 7, invitations were sent out in two separate launches: Soft Launch and Full Launch. Sixty panelists were included in the soft launch, which began with an initial invitation sent on Oct. 6, 2020. The ATP panelists chosen for the initial soft launch were known responders who had completed previous ATP surveys within one day of receiving their invitation. All remaining English- and Spanish-speaking panelists were included in the full launch and were sent an invitation on Oct. 7, 2020.
All panelists with an email address received an email invitation and up to two email reminders if they did not respond to the survey. All ATP panelists that consented to SMS messages received an SMS invitation and up to two SMS reminders.
Data quality checks
To ensure high-quality data, the Center’s researchers performed data quality checks to identify any respondents showing clear patterns of satisficing. This includes checking for very high rates of leaving questions blank, as well as always selecting the first or last answer presented. As a result of this checking, nine ATP respondents were removed from the survey dataset prior to weighting and analysis.
Weighting
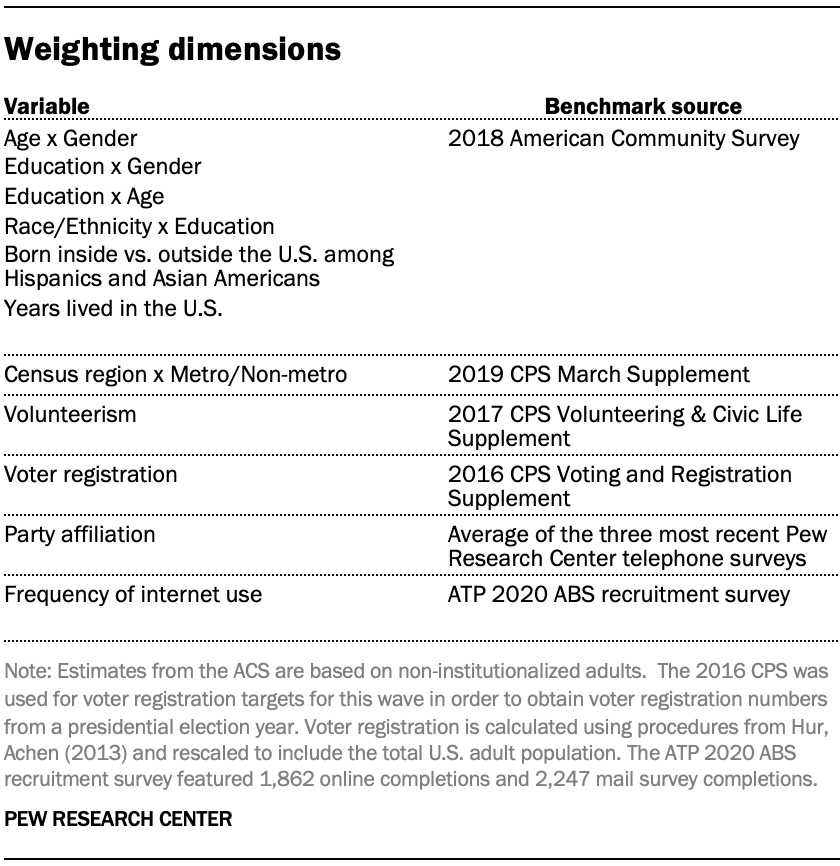
The ATP data was weighted in a multistep process that accounts for multiple stages of sampling and nonresponse that occur at different points in the survey process. First, each panelist begins with a base weight that reflects their probability of selection for their initial recruitment survey (and the probability of being invited to participate in the panel in cases where only a subsample of respondents were invited). The base weights for panelists recruited in different years are scaled to be proportionate to the effective sample size for all active panelists in their cohort. To correct for nonresponse to the initial recruitment surveys and gradual panel attrition, the base weights for all active panelists are calibrated to align with the population benchmarks identified in the accompanying table to create a full-panel weight.
For ATP waves in which only a subsample of panelists are invited to participate, a wave-specific base weight is created by adjusting the full-panel weights for subsampled panelists to account for any differential probabilities of selection for the particular panel wave. For waves in which all active panelists are invited to participate, the wave-specific base weight is identical to the full-panel weight.
In the final weighting step, the wave-specific base weights for panelists who completed the survey are again calibrated to match the population benchmarks specified above. These weights are trimmed (typically at about the 1st and 99th percentiles) to reduce the loss in precision stemming from variance in the weights. Sampling errors and test of statistical significance take into account the effect of weighting.
The following table shows the unweighted sample sizes and the error attributable to sampling that would be expected at the 95% level of confidence for different groups in the survey.
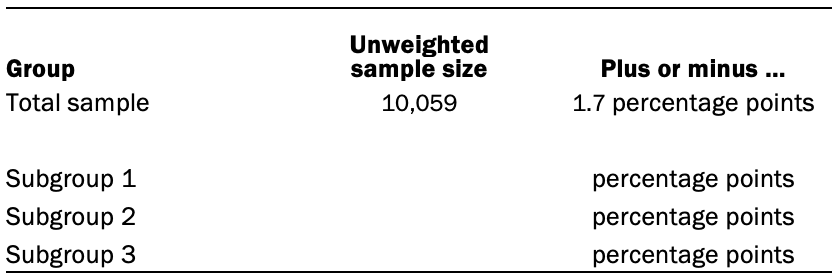
Sample sizes and sampling errors for other subgroups are available upon request. In addition to sampling error, one should bear in mind that question wording and practical difficulties in conducting surveys can introduce error or bias into the findings of opinion polls.
Dispositions and response rates

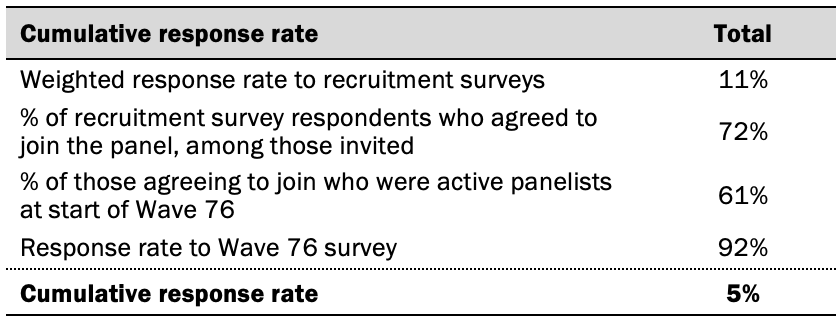
CORRECTION (October 2020): The Cumulative Response Rate table has been updated to reflect the correct numbers. None of the study findings or conclusions were affected.
© Pew Research Center, 2020
American Trends Panel September 2020 survey methodology
The American Trends Panel (ATP), created by Pew Research Center, is a nationally representative panel of randomly selected U.S. adults. Panelists participate via self-administered web surveys. Panelists who do not have internet access at home are provided with a tablet and wireless internet connection. Interviews are conducted in both English and Spanish. The panel is being managed by Ipsos.
Data in this report is drawn from the panel wave conducted Aug. 31 to Sept. 7, 2020. A total of 9,220 panelists responded out of 9,810 who were sampled, for a response rate of 94%. This does not include two panelists who were removed from the data due to extremely high rates of refusal or straightlining. The cumulative response rate accounting for nonresponse to the recruitment surveys and attrition is 5%. The break-off rate among panelists who logged on to the survey and completed at least one item is 1%. The margin of sampling error for the full sample of 9,220 respondents is plus or minus 1.7 percentage points.
The subsample from the ATP consisted of 9,810 ATP members that responded to the Wave 57 survey and the annual profile survey and were still active. Panelists who had not yet completed the annual profile survey were ineligible.
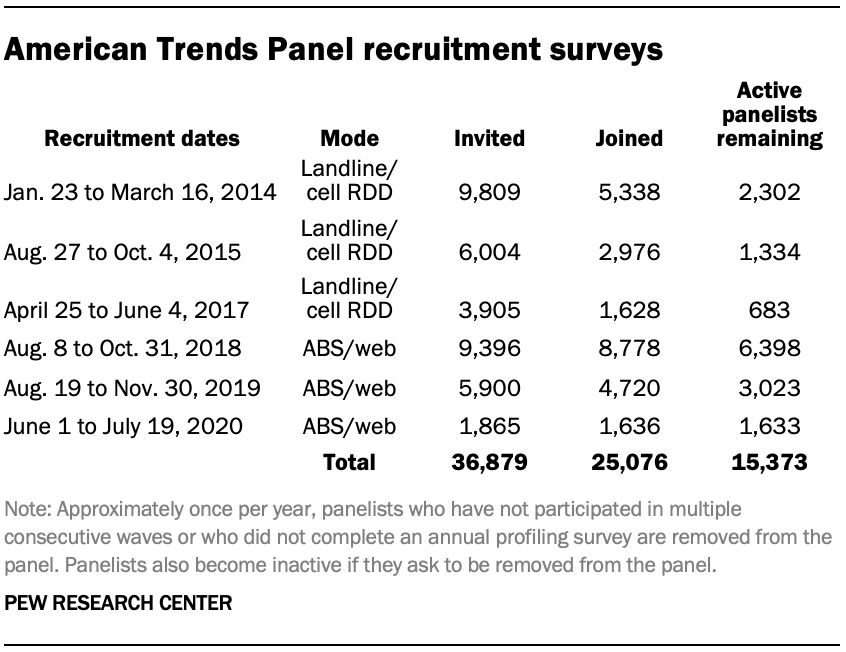
The ATP was created in 2014, with the first cohort of panelists invited to join the panel at the end of a large, national, landline and cellphone random-digit-dial survey that was conducted in both English and Spanish. Two additional recruitments were conducted using the same method in 2015 and 2017. Across these three surveys, a total of 19,718 adults were invited to join the ATP, of whom 9,942 agreed to participate.
In August 2018, the ATP switched from telephone to address-based recruitment. Invitations were sent to a random, address-based sample of households selected from the U.S. Postal Service’s Delivery Sequence File. In each household, the adult with the next birthday was asked to go online to complete a survey, at the end of which they were invited to join the panel. For a random half-sample of invitations, households without internet access were instructed to return a postcard. These households were contacted by telephone and sent a tablet if they agreed to participate. A total of 9,396 were invited to join the panel, and 8,778 agreed to join the panel and completed an initial profile survey. The same recruitment procedure was carried out on August 19, 2019, from which a total of 5,900 were invited to join the panel and 4,720 agreed to join the panel and completed an initial profile survey. Another recruitment using the same procedure was carried out on June 1, 2020, from which a total of 1,865 were invited to join the panel and 1,636 agreed to join the panel and completed an initial profile survey. Of the 25,076 individuals who have ever joined the ATP, 15,373 remained active panelists and continued to receive survey invitations at the time this survey was conducted.
The U.S. Postal Service’s Delivery Sequence File has been estimated to cover as much as 98% of the population, although some studies suggest that the coverage could be in the low 90% range.3 The American Trends Panel never uses breakout routers or chains that direct respondents to additional surveys.
Weighting
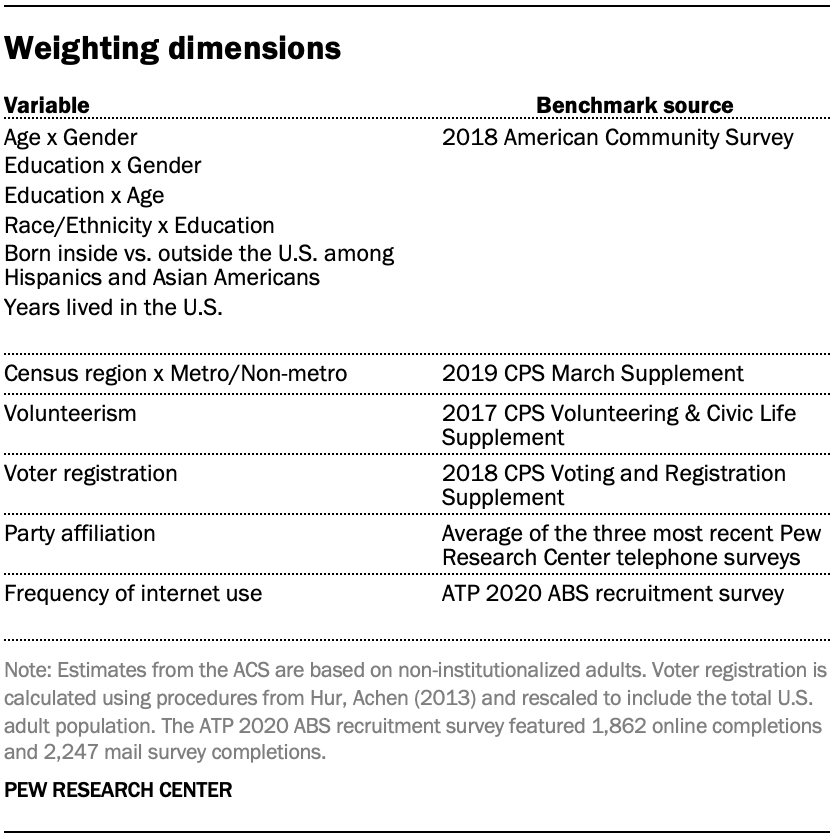
The ATP data was weighted in a multistep process that accounts for multiple stages of sampling and nonresponse that occur at different points in the survey process. First, each panelist begins with a base weight that reflects their probability of selection for their initial recruitment survey (and the probability of being invited to participate in the panel in cases where only a subsample of respondents were invited). The base weights for panelists recruited in different years are scaled to be proportionate to the effective sample size for all active panelists in their cohort. To correct for nonresponse to the initial recruitment surveys and gradual panel attrition, the base weights for all active panelists are calibrated to align with the population benchmarks identified in the accompanying table to create a full-panel weight.
For ATP waves in which only a subsample of panelists are invited to participate, a wave-specific base weight is created by adjusting the full-panel weights for subsampled panelists to account for any differential probabilities of selection for the particular panel wave. For waves in which all active panelists are invited to participate, the wave-specific base weight is identical to the full-panel weight.
In the final weighting step, the wave-specific base weights for panelists who completed the survey are again calibrated to match the population benchmarks specified above. These weights are trimmed (typically at about the 1st and 99th percentiles) to reduce the loss in precision stemming from variance in the weights. Sampling errors and test of statistical significance take into account the effect of weighting.
The following table shows the unweighted sample sizes and the error attributable to sampling that would be expected at the 95% level of confidence for different groups in the survey:
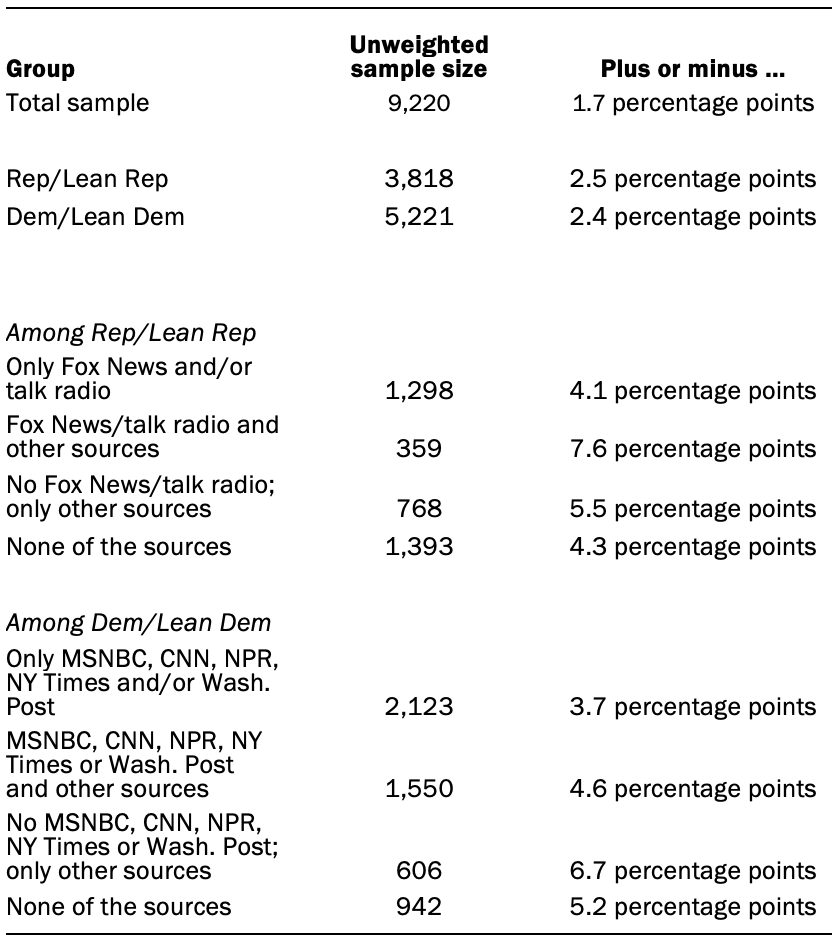
Sample sizes and sampling errors for other subgroups are available upon request. In addition to sampling error, one should bear in mind that question wording and practical difficulties in conducting surveys can introduce error or bias into the findings of opinion polls.
© Pew Research Center, 2020
American Trends Panel June 2020 survey methodology
The American Trends Panel (ATP), created by Pew Research Center, is a nationally representative panel of randomly selected U.S. adults. Panelists participate via self-administered web surveys. Panelists who do not have internet access at home are provided with a tablet and wireless internet connection. The panel is being managed by Ipsos.
Data in this report is drawn from the panel wave conducted June 4 to June 10, 2020. A total of 9,654 panelists responded out of 11,013 who were sampled, for a response rate of 88%. This does not include two panelists who were removed from the data due to extremely high rates of refusal or straightlining. The cumulative response rate accounting for nonresponse to the recruitment surveys and attrition is 4.7%. The break-off rate among panelists who logged on to the survey and completed at least one item is 1.6%. The margin of sampling error for the full sample of 9,654 respondents is plus or minus 1.6 percentage points.
The subsample from the ATP consisted of 11,013 ATP members that responded to the Wave 57 survey and were still active.
The ATP was created in 2014, with the first cohort of panelists invited to join the panel at the end of a large, national, landline and cellphone random-digit-dial survey that was conducted in both English and Spanish. Two additional recruitments were conducted using the same method in 2015 and 2017, respectively. Across these three surveys, a total of 19,718 adults were invited to join the ATP, of which 9,942 agreed to participate.
In August 2018, the ATP switched from telephone to address-based recruitment. Invitations were sent to a random, address-based sample (ABS) of households selected from the U.S. Postal Service’s Delivery Sequence File. In each household, the adult with the next birthday was asked to go online to complete a survey, at the end of which they were invited to join the panel. For a random half-sample of invitations, households without internet access were instructed to return a postcard. These households were contacted by telephone and sent a tablet if they agreed to participate. A total of 9,396 were invited to join the panel, and 8,778 agreed to join the panel and completed an initial profile survey. The same recruitment procedure was carried out on August 19, 2019, from which a total of 5,900 were invited to join the panel and 4,720 agreed to join the panel and completed an initial profile survey. Of the 23,440 individuals who have ever joined the ATP, 15,416 remained active panelists and continued to receive survey invitations at the time this survey was conducted.
The U.S. Postal Service’s Delivery Sequence File has been estimated to cover as much as 98% of the population, although some studies suggest that the coverage could be in the low 90% range. The American Trends Panel never uses breakout routers or chains that direct respondents to additional surveys.
Weighting
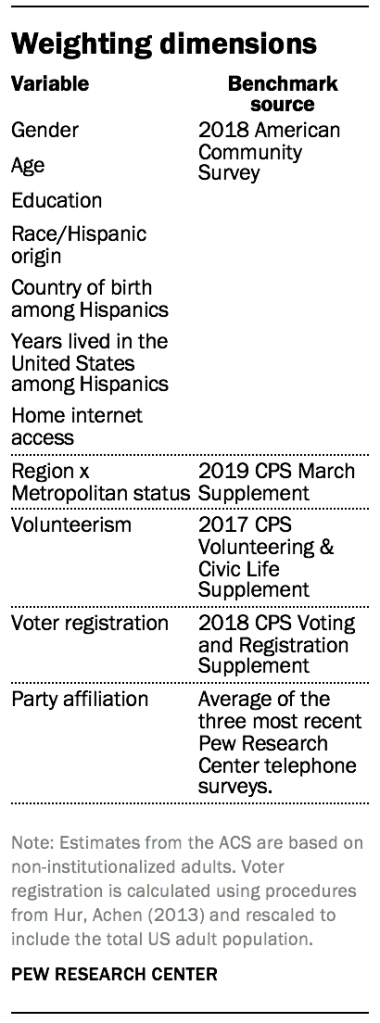
The ATP data was weighted in a multistep process that begins by calibrating the entire panel so that it aligns with the population benchmarks identified in the accompanying table to create a full-panel weight. For ATP waves in which only a subsample of panelists are invited to participate, a wave-specific base weight is created by adjusting the full-panel weights for subsampled panelists to account for any differential probabilities of selection for the particular panel wave. For waves in which all active panelists are invited to participate, the wave-specific base weight is identical to the full-panel weight. The next step in the weighting uses an iterative technique that aligns the sample to population benchmarks on the dimensions listed in the accompanying table.
Sampling errors and test of statistical significance take into account the effect of weighting. Interviews are conducted in both English and Spanish.
In addition to sampling error, one should bear in mind that question wording and practical difficulties in conducting surveys can introduce error or bias into the findings of opinion polls.
The following table shows the unweighted sample sizes and the error attributable to sampling that would be expected at the 95% level of confidence for different groups in the survey:
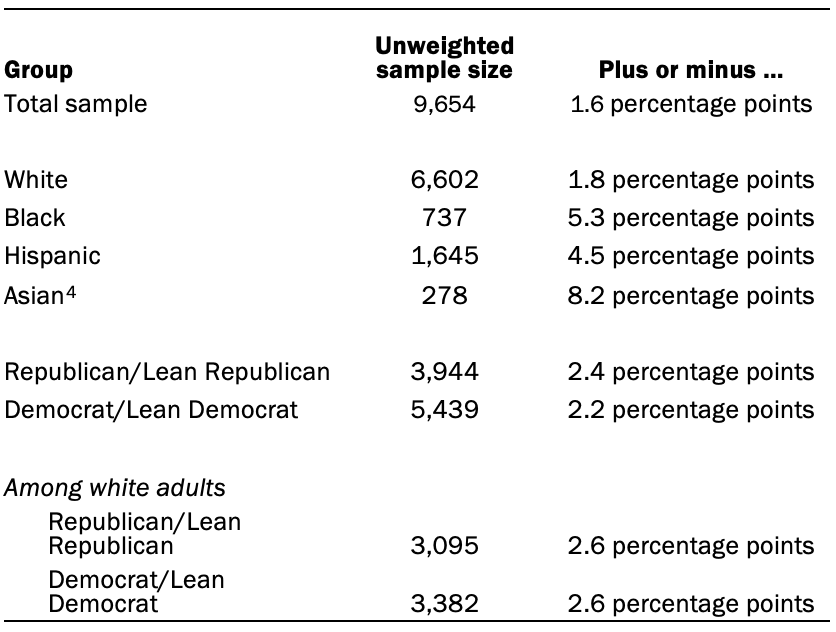
Sample sizes and sampling errors for other subgroups are available upon request.
A note about the Asian American sample
This survey includes a total sample size of 278 Asian Americans. The sample includes English-speaking Asian Americans only and, therefore, may not be representative of the overall Asian American population (74% of our weighted Asian American sample was born in another country, compared with 77% of the Asian American adult population overall). Despite this limitation, it is important to report the views of Asian Americans on the topics in this study. As always, Asian Americans’ responses are incorporated into the general population figures throughout this report. Because of the relatively small sample size and a reduction in precision due to weighting, we are not able to analyze Asian American respondents by demographic categories, such as gender, age or education.
© Pew Research Center, 2020
Weighting
The ATP data was weighted in a multistep process that begins by calibrating the entire panel so that it aligns with the population benchmarks identified in the accompanying table to create a full-panel weight. For ATP waves in which only a subsample of panelists are invited to participate, a wave-specific base weight is created by adjusting the full-panel weights for subsampled panelists to account for any differential probabilities of selection for the particular panel wave. For waves in which all active panelists are invited to participate, the wave-specific base weight is identical to the full-panel weight. The next step in the weighting uses an iterative technique that aligns the sample to population benchmarks on the dimensions listed in the accompanying table.
Sampling errors and test of statistical significance take into account the effect of weighting. Interviews are conducted in both English and Spanish.
In addition to sampling error, one should bear in mind that question wording and practical difficulties in conducting surveys can introduce error or bias into the findings of opinion polls.
American Trends Panel April 2020 survey methodology
The American Trends Panel (ATP), created by Pew Research Center, is a nationally representative panel of randomly selected U.S. adults. Panelists participate via self-administered web surveys. Panelists who do not have internet access at home are provided with a tablet and wireless internet connection. The panel is being managed by Ipsos.
Data in this report is drawn from the panel wave conducted April 20 to April 26, 2020. A total of 10,139 panelists responded out of 11,022 who were sampled, for a response rate of 92%. This does not include three panelists who were removed from the data due to extremely high rates of refusal or straightlining. The cumulative response rate accounting for nonresponse to the recruitment surveys and attrition is 5%. The break-off rate among panelists who logged on to the survey and completed at least one item is 0.01%. The margin of sampling error for the full sample of 10,139 respondents is plus or minus 1.5 percentage points.
The subsample from the ATP consisted of 11,022 ATP members that responded to the Wave 57 survey and were still active.
The ATP was created in 2014, with the first cohort of panelists invited to join the panel at the end of a large, national, landline and cellphone random-digit-dial survey that was conducted in both English and Spanish. Two additional recruitments were conducted using the same method in 2015 and 2017, respectively. Across these three surveys, a total of 19,718 adults were invited to join the ATP, of which 9,942 agreed to participate.
In August 2018, the ATP switched from telephone to address-based recruitment. Invitations were sent to a random, address-based sample (ABS) of households selected from the U.S. Postal Service’s Delivery Sequence File. In each household, the adult with the next birthday was asked to go online to complete a survey, at the end of which they were invited to join the panel. For a random half-sample of invitations, households without internet access were instructed to return a postcard. These households were contacted by telephone and sent a tablet if they agreed to participate. A total of 9,396 were invited to join the panel, and 8,778 agreed to join the panel and completed an initial profile survey. The same recruitment procedure was carried out on August 19, 2019, from which a total of 5,900 were invited to join the panel and 4,720 agreed to join the panel and completed an initial profile survey. Of the 23,440 individuals who have ever joined the ATP, 15,427 remained active panelists and continued to receive survey invitations at the time this survey was conducted.

The U.S. Postal Service’s Delivery Sequence File has been estimated to cover as much as 98% of the population, although some studies suggest that the coverage could be in the low 90% range.4 The American Trends Panel never uses breakout routers or chains that direct respondents to additional surveys.
Weighting
The ATP data was weighted in a multistep process that begins by calibrating the entire panel so that it aligns with the population benchmarks identified in the accompanying table to create a full-panel weight. For ATP waves in which only a subsample of panelists are invited to participate, a wave-specific base weight is created by adjusting the full-panel weights for subsampled panelists to account for any differential probabilities of selection for the particular panel wave. For waves in which all active panelists are invited to participate, the wave-specific base weight is identical to the full-panel weight. The next step in the weighting uses an iterative technique that aligns the sample to population benchmarks on the dimensions listed in the accompanying table.
Sampling errors and test of statistical significance take into account the effect of weighting. Interviews are conducted in both English and Spanish.
In addition to sampling error, one should bear in mind that question wording and practical difficulties in conducting surveys can introduce error or bias into the findings of opinion polls.
The following table shows the unweighted sample sizes and the error attributable to sampling that would be expected at the 95% level of confidence for different groups in the survey:
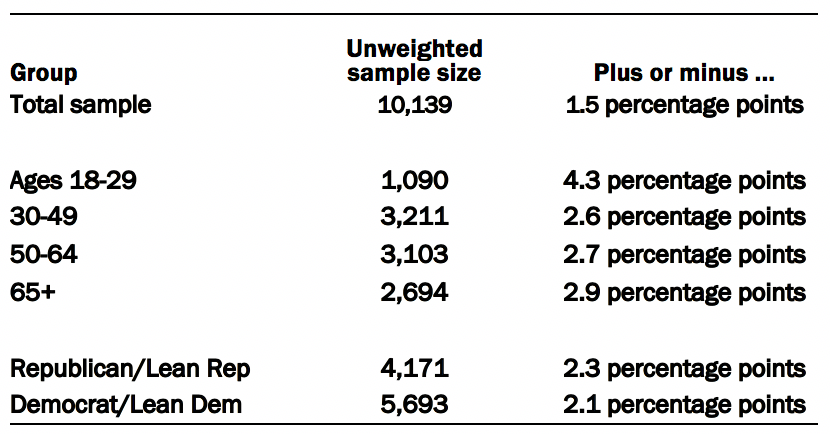
Sample sizes and sampling errors for other subgroups are available upon request.
© Pew Research Center, 2020
American Trends Panel March 2020 survey methodology
The American Trends Panel (ATP), created by Pew Research Center, is a nationally representative panel of randomly selected U.S. adults. Panelists participate via self-administered web surveys. Panelists who do not have internet access at home are provided with a tablet and wireless internet connection. The panel is being managed by Ipsos.

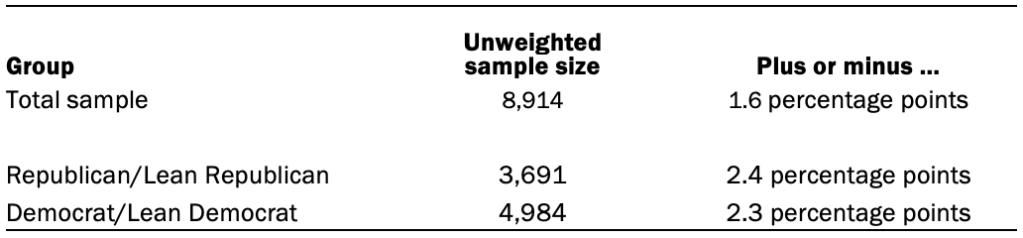
Data in this report is drawn from the panel wave conducted March 10 to March 16, 2020. A total of 8,914 panelists responded out of 11,028 who were sampled, for a response rate of 81%. This does not include four panelists who were removed from the data due to extremely high rates of refusal or straightlining. The cumulative response rate accounting for nonresponse to the recruitment surveys and attrition is 4.5%. The break-off rate among panelists who logged on to the survey and completed at least one item is 2.2%. The margin of sampling error for the full sample of 8,914 respondents is plus or minus 1.6 percentage points. The subsample from the ATP consisted of 11,028 ATP members that responded to the Wave 57 survey and were still active.
The ATP was created in 2014, with the first cohort of panelists invited to join the panel at the end of a large, national, landline and cellphone random-digit-dial survey that was conducted in both English and Spanish. Two additional recruitments were conducted using the same method in 2015 and 2017, respectively. Across these three surveys, a total of 19,718 adults were invited to join the ATP, of which 9,942 agreed to participate.
In August 2018, the ATP switched from telephone to address-based recruitment. Invitations were sent to a random, address-based sample (ABS) of households selected from the U.S. Postal Service’s Delivery Sequence File. In each household, the adult with the next birthday was asked to go online to complete a survey, at the end of which they were invited to join the panel. For a random half-sample of invitations, households without internet access were instructed to return a postcard. These households were contacted by telephone and sent a tablet if they agreed to participate. A total of 9,396 were invited to join the panel, and 8,778 agreed to join the panel and completed an initial profile survey. The same recruitment procedure was carried out on August 19, 2019, from which a total of 5,900 were invited to join the panel and 4,720 agreed to join the panel and completed an initial profile survey. Of the 23,440 individuals who have ever joined the ATP, 15,437 remained active panelists and continued to receive survey invitations at the time this survey was conducted.
The U.S. Postal Service’s Delivery Sequence File has been estimated to cover as much as 98% of the population, although some studies suggest that the coverage could be in the low 90% range. (AAPOR Task Force on Address-based Sampling. 2016. “AAPOR Report: Address-based Sampling.”)
Weighting
The ATP data was weighted in a multistep process that begins by calibrating the entire panel so that it aligns with the population benchmarks identified in the accompanying table to create a full-panel weight. For ATP waves in which only a subsample of panelists are invited to participate, a wave-specific base weight is created by adjusting the full-panel weights for subsampled panelists to account for any differential probabilities of selection for the particular panel wave. For waves in which all active panelists are invited to participate, the wave-specific base weight is identical to the full-panel weight. The next step in the weighting uses an iterative technique that aligns the sample to population benchmarks on the dimensions listed in the accompanying table.
Sampling errors and test of statistical significance take into account the effect of weighting. Interviews are conducted in both English and Spanish.
In addition to sampling error, one should bear in mind that question wording and practical difficulties in conducting surveys can introduce error or bias into the findings of opinion polls.
The following table shows the unweighted sample sizes and the error attributable to sampling that would be expected at the 95% level of confidence for different groups in the survey:
Sample sizes and sampling errors for other subgroups are available upon request.
© Pew Research Center, 2020
American Trends Panel February 2020 survey methodology
The American Trends Panel (ATP), created by Pew Research Center, is a nationally representative panel of randomly selected U.S. adults. Panelists participate via self-administered web surveys. Panelists who do not have internet access at home are provided with a tablet and wireless internet connection. The panel is being managed by Ipsos.
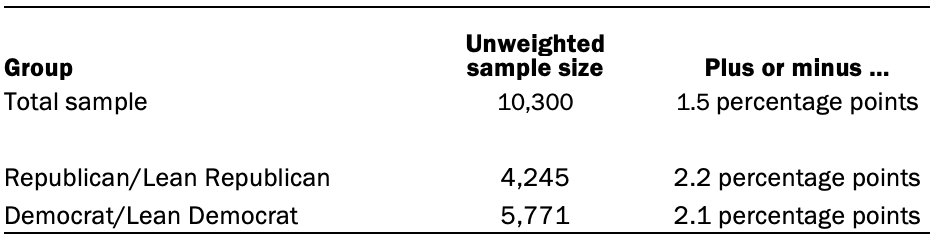
Data in the American News Pathways project is drawn from the panel wave conducted Feb. 18 to March 2, 2020. A total of 10,300 panelists responded out of 11,036 who were sampled, for a response rate of 93%. This does not include six panelists who were removed from the data due to extremely high rates of refusal or straightlining. The cumulative response rate accounting for nonresponse to the recruitment surveys and attrition is 5%. The break-off rate among panelists who logged onto the survey and completed at least one item is 1.3%. The margin of sampling error for the full sample of 10,300 respondents is plus or minus 1.5 percentage points.
The subsample from the ATP consisted of 11,036 ATP members that responded to the Wave 57 survey and were still active.
The ATP was created in 2014, with the first cohort of panelists invited to join the panel at the end of a large, national, landline and cellphone random-digit-dial survey that was conducted in both English and Spanish. Two additional recruitments were conducted using the same method in 2015 and 2017, respectively. Across these three surveys, a total of 19,718 adults were invited to join the ATP, of which 9,942 agreed to participate.
In August 2018, the ATP switched from telephone to address-based recruitment. Invitations were sent to a random, address-based sample (ABS) of households selected from the U.S. Postal Service’s Delivery Sequence File. In each household, the adult with the next birthday was asked to go online to complete a survey, at the end of which they were invited to join the panel. For a random half-sample of invitations, households without internet access were instructed to return a postcard. These households were contacted by telephone and sent a tablet if they agreed to participate. A total of 9,396 were invited to join the panel, and 8,778 agreed to join the panel and completed an initial profile survey. The same recruitment procedure was carried out on Aug. 19, 2019, from which a total of 5,900 were invited to join the panel and 4,720 agreed to join the panel and completed an initial profile survey. Of the 23,440 individuals who have ever joined the ATP, 15,448 remained active panelists and continued to receive survey invitations at the time this survey was conducted.
The U.S. Postal Service’s Delivery Sequence File has been estimated to cover as much as 98% of the population, although some studies suggest that the coverage could be in the low 90% range.5
Weighting
The ATP data was weighted in a multistep process that begins by calibrating the entire panel so that it aligns with the population benchmarks identified in the accompanying table to create a full-panel weight. For ATP waves in which only a subsample of panelists are invited to participate, a wave-specific base weight is created by adjusting the full-panel weights for subsampled panelists to account for any differential probabilities of selection for the particular panel wave. For waves in which all active panelists are invited to participate, the wave-specific base weight is identical to the full-panel weight. The next step in the weighting uses an iterative technique that aligns the sample to population benchmarks on the dimensions listed in the accompanying table.
Sampling errors and test of statistical significance take into account the effect of weighting. Interviews are conducted in both English and Spanish.
In addition to sampling error, one should bear in mind that question wording and practical difficulties in conducting surveys can introduce error or bias into the findings of opinion polls.
The following table shows the unweighted sample sizes and the error attributable to sampling that would be expected at the 95% level of confidence for different groups in the survey:
Sample sizes and sampling errors for other subgroups are available upon request.
© Pew Research Center, 2020
American Trends Panel November 2019 survey methodology
The American Trends Panel (ATP), created by Pew Research Center, is a nationally representative panel of randomly selected U.S. adults. Panelists participate via self-administered web surveys. Panelists who do not have internet access at home are provided a tablet and wireless internet connection. The panel is being managed by Ipsos.
Data in the American News Pathways project and the U.S. Media Polarization and the 2020 Election report are drawn from the panel wave conducted Oct. 29-Nov. 11, 2019. A total of 12,043 panelists responded out of 14,412 who were sampled, for a response rate of 84%. This does not include 12 panelists who were removed from the data due to extremely high rates of refusal or straightlining. The cumulative response rate accounting for nonresponse to the recruitment surveys and attrition is 4.5%. The break-off rate among panelists who logged onto the survey and completed at least one item is 0.2%. The margin of sampling error for the full sample of 12,043 respondents is plus or minus 1.43 percentage points.
The ATP was created in 2014, with the first cohort of panelists invited to join the panel at the end of a large national, landline and cellphone random-digit-dial survey that was conducted in both English and Spanish. Two additional recruitments were conducted using the same method in 2015 and 2017, respectively. Across these three surveys, a total of 19,718 adults were invited to join the ATP, of which 9,942 agreed to participate.
In August 2018, the ATP switched from telephone to address-based recruitment. Invitations were sent to a random, address-based sample (ABS) of households selected from the U.S. Postal Service’s Delivery Sequence File. In each household, the adult with the next birthday was asked to go online to complete a survey, at the end of which they were invited to join the panel. For a random half-sample of invitations, households without internet access were instructed to return a postcard. These households were contacted by telephone and sent a tablet if they agreed to participate. A total of 9,396 were invited to join the panel, and 8,778 agreed to join the panel and completed an initial profile survey. The same recruitment procedure was carried out on Aug. 19, 2019, from which a total of 4,700 were invited to join the panel and 3,652 agreed as of Oct. 25, 2019. Of the 22,372 individuals who have ever joined the ATP, 14,412 remained active panelists and continued to receive survey invitations at the time this survey was conducted.
The U.S. Postal Service’s Delivery Sequence File has been estimated to cover as much as 98% of the population, although some studies suggest that the coverage could be in the low 90% range.6
Weighting
The ATP data was weighted in a multistep process that begins by calibrating the entire panel so that it aligns with the population benchmarks identified in the accompanying table to create a full-panel weight. For ATP waves in which only a subsample of panelists are invited to participate, a wave-specific base weight is created by adjusting the full-panel weights for subsampled panelists to account for any differential probabilities of selection for the particular panel wave. For waves in which all active panelists are invited to participate, the wave-specific base weight is identical to the full-panel weight. The next step in the weighting uses an iterative technique that aligns the sample to population benchmarks on the dimensions listed in the accompanying table.
Sampling errors and test of statistical significance take into account the effect of weighting. Interviews are conducted in both English and Spanish.
In addition to sampling error, one should bear in mind that question wording and practical difficulties in conducting surveys can introduce error or bias into the findings of opinion polls.
The following table shows the unweighted sample sizes and the error attributable to sampling that would be expected at the 95% level of confidence for different groups in the survey:
Sample sizes and sampling errors for other subgroups are available upon request.
© Pew Research Center, 2020
Selection of news sources
The 30 sources included in the American News Pathways project were chosen so that respondents were asked about a range of news media across different platforms (e.g., television, print, radio, internet). Researchers also considered audience size, topic areas covered and relevance to political news during the 2016 election and afterwards.
The final list of 30 news outlets asked about consists of the following: four of the major broadcast television networks (ABC News, CBS News, NBC News and Univision), three major cable television news networks (CNN, Fox News and MSNBC), four of the largest newspapers by national circulation (The New York Times, The Washington Post, The Wall Street Journal and USA Today), the two major public broadcast networks (NPR and PBS), two political news radio programs with large audiences (The Rush Limbaugh Show and The Sean Hannity Show), two international media organizations with large domestic audiences (BBC and The Guardian), news websites regardless of their original platform that cover politics and had comparatively high traffic during the fourth quarter of 2018 (BuzzFeed, Vice, New York Post, Time magazine, Newsweek, Politico and Vox), one business-focused outlet with political content and higher web traffic in the time period analyzed than other similar outlets (Business Insider), and other outlets included in external lists of key political sources during the 2016 presidential election and after, selected with traffic and social media engagement figures in mind (Breitbart, The Hill, Daily Caller, HuffPost and The Washington Examiner).7 News sources that mostly serve as aggregators of news (e.g., Google News) and social media outlets were asked about in a separate question.
Main source of political and election news
In addition to the series of questions about these specific outlets, respondents were also asked in an open-ended question to volunteer their main source for news. This allowed respondents to name any source, not limiting them to the specific ones asked about in the survey questions. If respondents volunteered more than one source, the first one mentioned was accepted.
Researchers grouped these open-ended responses together by brand; for instance “NY Times,” “NYT” and “nytimes.com” would all be counted as indicating that The New York Times was the respondent’s main source. Additionally, individual local news sources were grouped together into categories such as “local newspapers” and “local TV.”
All outlets that were named by 1.0% or more respondents as their main source for news are reported in the topline. All other sources named are grouped into “Other”.
Awareness, trust, distrust and use of news sources
In this study, respondents were asked about their awareness of and trust in 30 different news sources. Respondents were first asked whether they have heard of each source. Icons for and names of the sources were arrayed on two screens of 15 sources each.8 The order of the sources on each screen and the order of the two screens were randomized. Respondents were then shown a grid of just the sources that they had heard of and asked to click on the ones they trust for political and election news. They then saw a grid that showed the sources they had heard of but had not indicated that they trust and were asked if they distrust the remaining sources. If a respondent had heard of a source but did not indicate trust or distrust of it, the response was considered “neither trust nor distrust.” Finally, respondents were asked if they got political or election news in the past week from any of the sources that they heard of.
Average audience placement of each outlet based on party and ideology
One section of the report shows the average audience placement of each of the 30 news outlets in a number line based on an index of self-reported party identification and political ideology. Each respondent was assigned a value on a nine-point index based on their responses to questions about their party identification and political ideology. The placement of each outlet’s audience is based on the average value of those who reported getting political and election news from the outlet in the past week. The number values in the index are:
- 1 = Very conservative Republican/Lean Republican
- 2 = Conservative Republican/Lean Republican
- 3 = Moderate Republican/Lean Republican
- 4 = Liberal or very liberal Republican/Lean Republican
- 5 = No lean/Other response
- 6 = Conservative or very conservative Democrat/Lean Democrat
- 7 = Moderate Democrat/Lean Democrat
- 8 = Liberal Democrat/Lean Democrat
- 9 = Very liberal Democrat/Lean Democrat
Outlet groupings by audience makeup
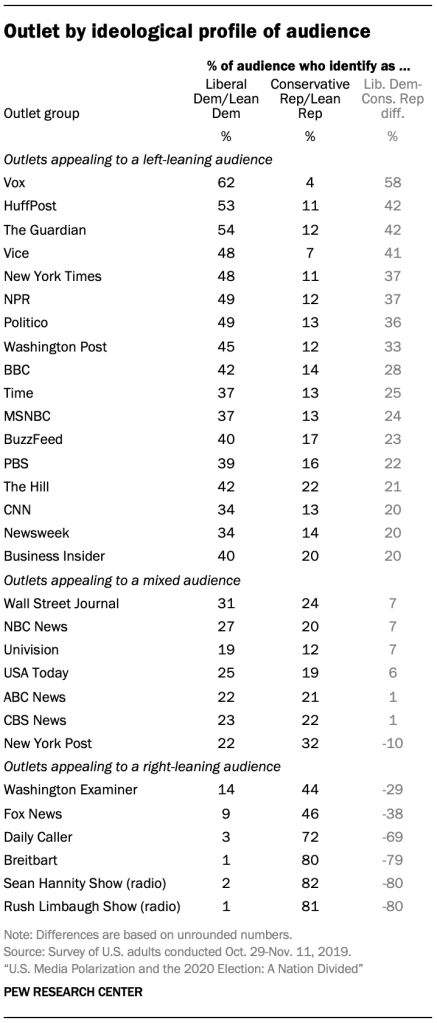
Each outlet was grouped according to the ideological composition of its audience. This grouping is based on the ratio of the proportion of the audience who self-identify as liberal Democrats (including independents who lean Democratic) to the proportion that identify as conservative Republicans (including independents who lean Republican).
The survey asked respondents to indicate whether they got “political and election news” from 30 national news outlets in the past week. An outlet is considered to have a left-leaning audience if the proportion of those who got news there that identify as liberal Democrats is at least two-thirds higher than the proportion that identify as conservative Republicans. Alternatively, an outlet is considered to have a right-leaning audience if the proportion of all audience members that identify as conservative Republicans is at least two-thirds higher than the proportion that identify as liberal Democrats. And an outlet is classified as having a mixed audience if neither liberal Democrats nor conservative Republicans make up at least two-thirds or more of the audience than the other.
Data for classifying the ideological composition of news outlets comes from the first survey of Pew Research Center’s American News Pathways project, conducted Oct. 29-Nov. 11, 2019, among 12,043 U.S. adults.


