This report – a study of news on YouTube – uses three different research components and methodologies, including a national representative survey of U.S. adults conducted through Pew Research Center’s American Trends Panel (ATP) and a content analysis of YouTube channels and the news videos they produced.
Survey
The American Trends Panel (ATP), created by Pew Research Center, is a nationally representative panel of randomly selected U.S. adults. Panelists participate via self-administered web surveys. Panelists who do not have internet access at home are provided with a tablet and wireless internet connection. The panel is being managed by Ipsos.
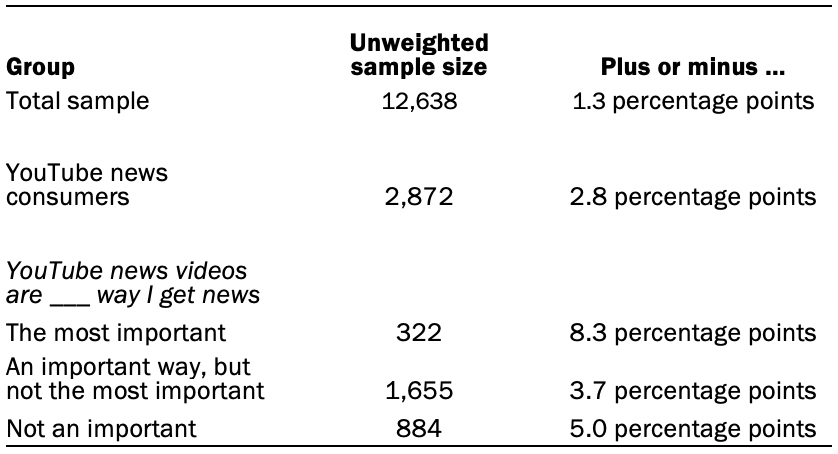
Data in this report are drawn from the panel wave conducted January 6 to January 20, 2020. A total of 12,638 panelists responded out of 15,463 who were sampled, for a response rate of 82%. This does not include nine panelists who were removed from the data due to extremely high rates of refusal or straightlining. The cumulative response rate accounting for nonresponse to the recruitment surveys and attrition is 5.3%. The break-off rate among panelists who logged onto the survey and completed at least one item is 1%. The margin of sampling error for the full sample of 12,638 respondents is plus or minus 1.3 percentage points.
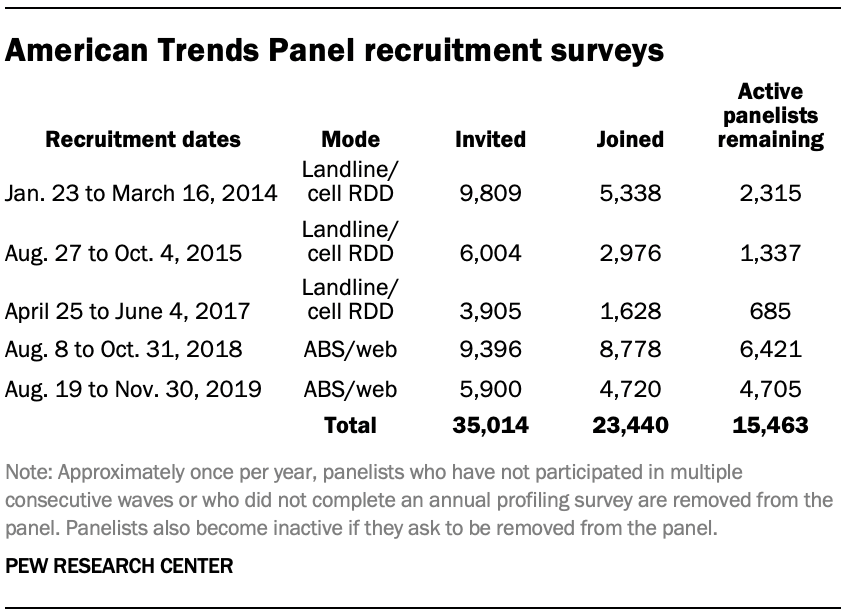
The ATP was created in 2014, with the first cohort of panelists invited to join the panel at the end of a large, national, landline and cellphone random-digit-dial survey that was conducted in both English and Spanish. Two additional recruitments were conducted using the same method in 2015 and 2017, respectively. Across these three surveys, a total of 19,718 adults were invited to join the ATP, of which 9,942 agreed to participate.
In August 2018, the ATP switched from telephone to address-based recruitment. Invitations were sent to a random, address-based sample (ABS) of households selected from the U.S. Postal Service’s Delivery Sequence File. In each household, the adult with the next birthday was asked to go online to complete a survey, at the end of which they were invited to join the panel. For a random half-sample of invitations, households without internet access were instructed to return a postcard. These households were contacted by telephone and sent a tablet if they agreed to participate. A total of 9,396 were invited to join the panel, and 8,778 agreed to join the panel and completed an initial profile survey. The same recruitment procedure was carried out on August 19, 2019, from which a total of 5,900 were invited to join the panel and 4,720 agreed to join the panel and completed an initial profile survey. Of the 23,440 individuals who have ever joined the ATP, 15,463 remained active panelists and continued to receive survey invitations at the time this survey was conducted.
The U.S. Postal Service’s Delivery Sequence File has been estimated to cover as much as 98% of the population, although some studies suggest that the coverage could be in the low 90% range.12
Weighting
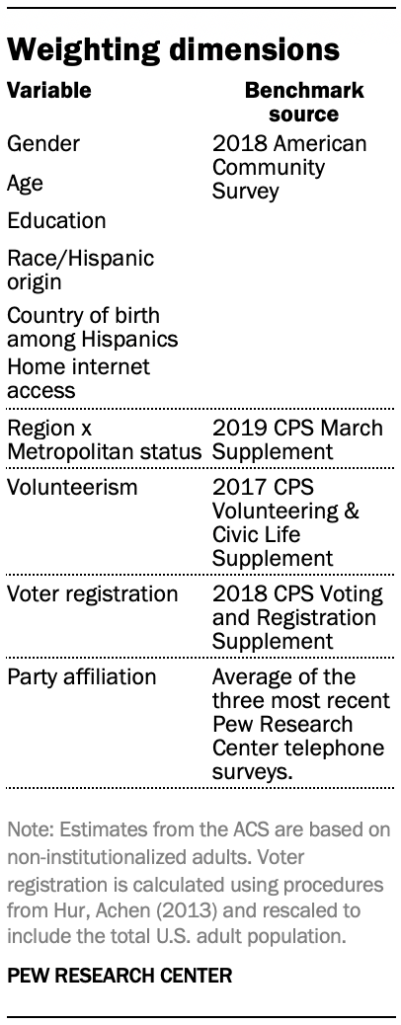
The ATP data was weighted in a multistep process that begins by calibrating the entire panel so that it aligns with the population benchmarks identified in the accompanying table to create a full-panel weight. For ATP waves in which only a subsample of panelists are invited to participate, a wave-specific base weight is created by adjusting the full-panel weights for subsampled panelists to account for any differential probabilities of selection for the particular panel wave. For waves in which all active panelists are invited to participate, the wave-specific base weight is identical to the full-panel weight. The next step in the weighting uses an iterative technique that aligns the sample to population benchmarks on the dimensions listed in the accompanying table.
Sampling errors and test of statistical significance take into account the effect of weighting. Interviews are conducted in both English and Spanish.
In addition to sampling error, one should bear in mind that question wording and practical difficulties in conducting surveys can introduce error or bias into the findings of opinion polls.
The following table shows the unweighted sample sizes and the error attributable to sampling that would be expected at the 95% level of confidence for different groups in the survey:
Sample sizes and sampling errors for other subgroups are available upon request.
Content analysis of YouTube news channels and videos
Overview
To better understand the news content people are exposed to in YouTube, this part of the study analyzed 377 popular YouTube channels that primarily produced videos about news and current affairs and 2,967 news videos produced by a subset of the most-viewed 100 of these channels.
YouTube news channels selection
News channels were identified by adapting a mapping method from prior Pew Research Center research that used a set of seed channels and YouTube video recommendations to iteratively find related channels. Researchers started with an initial list of 145 channels compiled from multiple lists of news channels on YouTube, including:13
- 81 channels associated with news organizations that were included in Pew Research Center’s 2019 State of the News Media report;
- 26 channels that had at least 250,000 subscribers as of December 2018, and that talked about U.S. news, politics, or current events in at least half their videos during the first week of 2019;
- 70 news channels that were shared on Twitter by at least five different respondents in a nationally representative survey conducted June 10, 2018, through June 9, 2019 (for more information about this survey, see its methodology); and
- YouTube’s aggregate “News” channel, which provides a feed of videos that YouTube has marked as news from across channels.
Researchers used this list of 145 channels to find more channels via YouTube’s recommendation engine in order to capture as many channels as possible that could offer news content to YouTube users. To do so, researchers used an iterative process, with the output of one process used as the seed channels for a second iteration of the process. This expanded the pool of potential news channels.
For each channel, researchers ran a script in November 2019 to query the YouTube API for lists of recommended videos for each of the channel’s most recent videos. The script was not logged into a YouTube account in an effort to minimize personalized recommendations. Researchers then removed channels that had fewer than 100,000 subscribers and used two different methods to identify and remove non-English channels. First, researchers used a Python script to remove any channel in which more than 50% of its title and description did not use English language (non-ASCII) characters – common for foreign language channels. Second, researchers used the langdetect Python package to identify channels whose title and description were in English. This package reports the probability that text is in a given language, and any channels whose title and descriptions were found to have less than a 50% probability of being in English were excluded.
Once a list of recommended channels was collected, researchers determined whether these channels primarily published videos about politics and current event news. To do so, human coders visited the “Videos” tab of each channel in November 2019 and considered the title and featured image for each of its 15 most recent videos. A channel was included if at least half of those videos were about political news or current affairs and not solely focused on non-political conspiracies, lifestyles, reviews, or other non-news or current affairs content. Channels that were mostly documentaries were also excluded.
The channels discovered using these recommendation and filtering processes were then used as a new set of seed channels, and the whole process was repeated with these seed channels.
After running the recommendation and filtering processes twice, human coders had examined 17,797 channels and identified a final total of 377 popular channels with at least 100,000 subscribers that primarily published videos about news or current affairs in November 2019.
Channel audit
Next, researchers conducted an analysis of key characteristics of those 377 channels. This audit investigated key components of each channel’s identity, community and fundraising.
Coders were given multiple sets of YouTube channels to evaluate during the training period. Once internal agreement on how to code the variables was established, coding of the channels for the study began. Agreement was tested using Fleiss’s Kappa, a common intercoder reliability measure for multiple coders (five coders were trained but only two conducted this phase of the research because of the smaller number of channels; the scores below are the agreement between those two). The mean Kappa across variables was 0.89, with a minimum of 0.79 (“Affiliation”) and several variables showing full agreement.
Below are the main measures and their Kappas (minimum and average reported for variables with multiple, non-exclusive options, like select alls):
- Digital platform – 0.73 or higher (average is 0.93)
- Ideology – 0.88
- Donation type – 0.65 or higher (average is 0.82)
- Donation privileges – 1.0
- Merchandise – 1.0
- Personality driven – 0.82
- Affiliation – 0.79
Upon reaching an acceptable level of intercoder reliability, all channels were coded by two coders.
Throughout the coding process, staff discussed questions as they arose and arrived at decisions under supervision of the content analysis team leader. In addition, the lead researcher checked coders’ accuracy throughout the process.
Video coding
Throughout December 2019, researchers collected every video that was produced by each of the 377 popular news channels; 89% of the channels posted at least one video during the month, and each video was tracked for a week after its publication to collect its 7-day view count and other measures.
Overall, the 377 news channels produced 37,095 videos in December 2019. Due to time considerations and the sheer volume of videos, researchers were only able to examine and analyze videos that were produced by a subset of the 377 popular news channels. Researchers focused on the 100 most-viewed news channels, which were selected by examining the views their typical (median) video received in December 2019. However, this still included some channels that did not primarily publish videos about news in December 2019 (although they had done so in November), and channels that were dedicated to local news. To ensure these weren’t included in the sample, two researchers manually reviewed the titles and descriptions for the videos published by the top 100 channels and removed channels that focused on local news and channels that did not primarily publish videos about politics or current affairs during December 2019. These removed channels were then replaced with the next most-viewed candidates, and this process was repeated until researchers arrived at a final list of the 100 most-viewed national news channels, which collectively produced 4,864 videos during the month.
A set of five coders were then trained to evaluate these channels’ videos across several metrics, including topic, focus, tone, and use of journalistic practices like sources.
Before training, codes for each variable were developed through an iterative process of identifying common elements. For example, for the conspiracy variable, researchers found several conspiracy theories or unproven claims that were prominently discussed in the news media in late 2019: QAnon/deep state conspiracy theories, theories related to Jeffrey Epstein and anti-vaccine theories. By looking at a sample of videos, researchers determined that QAnon- and Epstein-related theories were particularly common and trained coders to identify discussions of them based on the terms and tenets of the theories. Once trained, researchers coded for these conspiracy theories based on this information. However, researchers did not attempt to determine if the video was supporting or promoting the theory. In cases where a conspiracy theory outside this list was discussed, coders discussed the theory with the lead researcher, who investigated whether the ideas were connected to a conspiracy theory. However, after coding, it was clear that only QAnon was discussed regularly in these videos, so all other conspiracy theories were grouped into Other.
Fleiss’s Kappa was also used to measure intercoder agreement. The mean Kappa across variables was a 0.7, with a minimum of 0.70 (“Focus”) and a max of 0.82 (“News Focus”).
Below are the main measures and their Kappas (minimum and average reported for variables with multiple, non-exclusive options, like select alls):
- News focus – 0.82
- Source type: 0.62 or higher (average is 0.75)
- Interview – 0.71
- Primary topic – 0.81
- Topic mentioned – 0.71 or higher (average is 0.81):
- Conspiracy – 0.79
- Focus – 0.70
- Tone – 0.71
Once coders were trained, researchers drew a representative, chronologically stratified sample of videos for each of the top 100 news channels using half-open random sampling. The number of videos sampled from each channel varied depending on the number of videos each channel produced in December 2019, but with the exception of a handful channels that produced a large number of videos (the most prolific of which was MSNBC, with 578 videos – 12% of the total), a channel’s sample typically included most or all of the videos that it produced during the month.
Coders then examined each video in the sample. First, because many channels offered a mix of entertainment and news videos (even if most of their videos were about news), videos that were determined to not be about news were removed from the sample and replaced with the next video, chronologically. This process was continued until a video that was about news was sampled.
Altogether, 3,626 videos produced by the top 100 news channels in December 2019 were sampled and classified. These videos were subsequently adjusted using channel-level propensity weights to be representative of the full collection of videos. About one-in-five (18%) of the sampled videos were not about current affairs and were excluded from the analysis, resulting in a final selection of 2,967 videos.