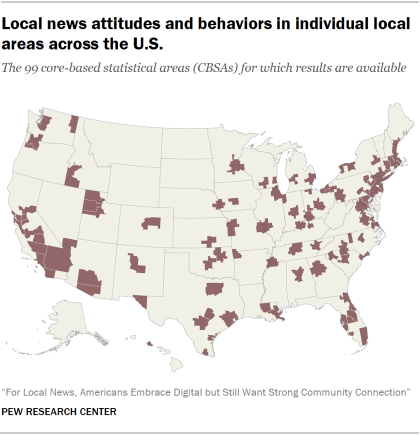
This survey of nearly 35,000 randomly selected adults from across the United States was designed at a large enough scale to allow for a geographically granular view of the local news landscape. As such, this report is accompanied by an online, interactive feature that lets readers explore the local news behaviors and attitudes of Americans living in 99 different local areas. These areas, referred to by the U.S. federal government as core-based statistical areas (or CBSAs), can be roughly described as an urban center and its suburbs.
CBSAs – or core-based statistical areas – are geographic areas defined by the U.S. federal government as consisting of at least one urban core of 10,000 people or more, plus adjacent counties that are socio-economically tied to the urban center.
There are two types of CBSAs: metropolitan statistical areas and micropolitan statistical areas. A metropolitan statistical area must have at least one urban core with a population of 50,000 or more inhabitants. A micropolitan statistical area must have at least one urban core with a population of at least 10,000 and less than 50,000 people. In total, there are 933 CBSAs in the 50 states and District of Columbia comprising 1,825 counties. About 94% of the population lives in one of these CBSAs.
For more information, see the Methodology.
San Antonio-New Braunfels, TX
See all results for the San Antonio area.
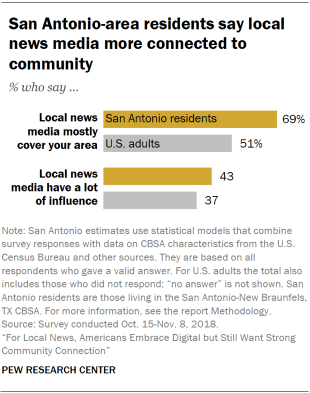
San Antonio is a community where residents have positive attitudes about their local news media’s connection to the local community and performance.
Residents of this area feel more connection with their local news media than do U.S. adults overall. Most strikingly, approximately two-thirds of San Antonio-area residents (69%) say their local news media mostly cover the area they live, compared with 51% of U.S. adults overall. Residents are also more likely to say local news has an influence on the community (43% vs. 37% of U.S. adults).
As is the case across the United States, San Antonio-area residents’ strong sense that their local news media are connected to the community relates closely to positive ratings of their local media’s performance. Those in the San Antonio area are more confident than U.S. adults overall in their main source for local news (37% are very confident vs. 30% of U.S. adults). They are also more likely to say local journalists do well at being transparent (73% vs. 62% of U.S. adults), covering issues daily (77% vs. 67%) and representing people like them (66% vs. 58%).
San Antonio-New Braunfels, TX CBSA
- 2.3 million residents
- Median age: 34
- Median annual household income: $54,638
- 27% have at least a college degree
- 6% black, 55% Hispanic, 35% white
- 14% of population in rural area
- 46% voter turnout in 2016
- 16% say they are very attached to the community
Note: Whites and blacks are single-race non-Hispanics. Hispanics are of any race. Source: Survey conducted Oct. 15-Nov. 8, 2018; Pew Research Center analysis of American Community Survey data and data from Dave Leip’s Atlas of U.S. Presidential Elections.
The most prominent main source for San Antonio-area residents’ local news (as volunteered in an open-ended question) is KSAT, an ABC affiliate TV station (33%). Local TV stations KENS, a CBS affiliate (9%) and KABB, a Fox affiliate (4%), are also named. The San Antonio Express-News, the local metro daily paper, is named by 6%.
These findings mostly mirror the results for their use of different provider types: Nearly half of San Antonio-area residents (47%) often get local news from TV stations, higher than any other provider type, and higher than among U.S. adults overall (38%). Meanwhile, only one-in-ten San Antonio residents say they get news often from their local daily paper (compared with 17% of U.S. adults). There are no differences between San Antonio-area residents and U.S. adults overall in the rates at which they get local news often from radio stations (18% vs. 20%).
San Antonio residents place something of a premium on social media for news. Although they are no more likely than U.S. adults overall to often get local news on social media, they are more likely to prefer social media as a pathway to local news (20% vs. 15%). They are also less likely to prefer news websites and apps (17% vs. 23%), and, when it comes to getting local news online, less likely to prefer desktop/laptop computers to mobile devices (17% vs. 27%).
Minneapolis-St. Paul-Bloomington, MN-WI
See all results for the Minneapolis-St. Paul area.
Residents of the Minneapolis-St. Paul area are also very positive in their evaluations of local news and are more likely than U.S. adults overall to prefer legacy platforms when accessing providers.
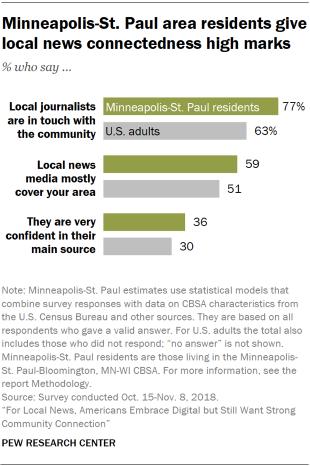
Twin Cities residents are more likely than U.S. adults overall to say their local media are connected, both in terms of local journalists being in touch (77% vs. 63% of U.S. adults) and local news media mainly covering their area (59% vs. 51%). As in San Antonio, the greater feelings of connectedness are tied to more positive evaluations. Minneapolis-St. Paul area residents are more likely to say they are very confident in their main source for local news (36% vs. 30% of U.S. adults) and that their local news media do well at nearly all roles asked about, particularly representing people like them (68% vs. 58%), keeping an eye on local political leaders (77% vs. 66%) and being transparent (72% vs. 62%). However, residents of this area show no higher interest in local news (31% follow very closely, the same as among U.S. adults).
Minneapolis-St. Paul residents are somewhat more likely than U.S. adults overall to prefer non-digital pathways as their primary access point for different provider types. Among those getting local news from a daily newspaper, 62% of residents prefer print, compared with 54% of U.S. adults. Similarly, 90% of Minneapolis-St. Paul area residents who get news from local radio stations primarily do so on an actual radio, more than the 81% of equivalent U.S. adults who say so (St. Paul is the home of public radio distributor American Public Media). And, for those getting news from local TV stations, 85% in this area prefer the TV to digital forms, compared with 76% of U.S. adults. At the same time, though, Twin Cities area residents say they use social media and websites for local news at about the same rates as the population overall.
Minneapolis-St. Paul-Bloomington, MN-WI CBSA
- 3.5 million residents
- Median age: 37
- Median annual household income: $70,915
- 40% have at least a college degree
- 8% black, 6% Hispanic, 77% white
- 12% of population in rural area
- 73% voter turnout in 2016
- 25% say they are very attached to the community
Note: Whites and blacks are single-race non-Hispanics. Hispanics are of any race. Source: Survey conducted Oct. 15-Nov. 8, 2018; Pew Research Center analysis of American Community Survey data and data from Dave Leip’s Atlas of U.S. Presidential Elections.
Asked to write in their main source for local news, one-in-ten residents volunteer the daily Minneapolis Star Tribune, while 14% name NBC affiliate KARE and 12% name CBS affiliate WCCO. In addition, 7% name Minneapolis Public Radio and 2% name the St. Paul daily Pioneer Press. In general, those in the Minneapolis-St. Paul area access local providers at roughly the same rate as U.S. adults overall, with local TV the most common (36% get local news there often) followed by radio stations (21%) and daily newspapers (19%).
Riverside-San Bernardino-Ontario, CA
See all results for the Riverside area.
In contrast to San Antonio and Minneapolis, residents of the Riverside area seem to be suffering a kind of malaise when it comes to local news. Compared with U.S. adults overall, Riverside residents are less likely to use local news media, rate them highly or say they are in touch with their community. However, Riverside-area residents are somewhat more likely to prefer social media for local news.
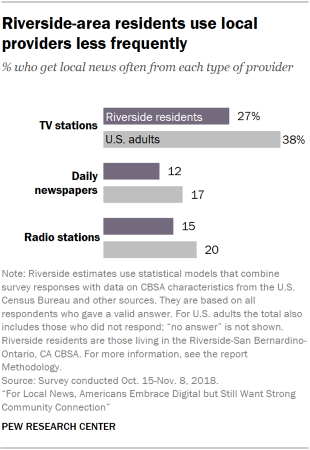
In addition to being less interested in local news overall – a quarter follow local news very closely, compared with 31% of U.S. adults – Riverside residents also get local news less often from the three main provider types (TV stations, daily newspapers and radio stations). About a quarter (27%) get news often from local TV stations (vs. 38% of U.S. adults), about one-in-ten (12%) from the daily paper (vs. 17% of U.S adults) and 15% from local radio stations (vs. 20% of U.S. adults). Perhaps as a consequence, they are also less likely to pay for local news – 9% of Riverside-area residents do, compared with 14% of U.S. adults.
Riverside-area residents are less likely than U.S. adults overall to say local news media mostly cover the area where they live, are less confident in their main source of local news, and do not find it as easy to get information about different topics. Fewer than half of Riverside-area residents say their local news media mostly cover their area (44%), compared with 51% of U.S. adults, though there are no differences on the questions of local journalists being in touch or local media being influential. In terms of how well local news media do, those in Riverside are less likely to be very confident in their main source of local news (23% vs. 30% of U.S. adults) and to say their local news media are doing very well at their job (18% vs. 24%).
Riverside-San Bernardino-Ontario, CA CBSA
- 4.4 million residents
- Median age: 34
- Median annual household income: $56,295
- 20% have at least a college degree
- 7% black, 50% Hispanic, 34% white
- 5% of population in rural area
- 43% voter turnout in 2016
- 15% say they are very attached to the community
Note: Whites and blacks are single-race non-Hispanics. Hispanics are of any race. Source: Survey conducted Oct. 15-Nov. 8, 2018; Pew Research Center analysis of American Community Survey data and data from Dave Leip’s Atlas of U.S. Presidential Elections.
The difference is clearest when it comes to the ease of getting information on particular topics: On all but two topics, Riverside-area residents are less likely than U.S. adults to say it is very easy to get information. For instance, among Riverside residents who follow sports, 39% say it is very easy to get information, compared with about half of U.S. adults (52%) who follow sports and say the same.
Amid this negativity, Riverside-area residents do show some higher preference for social media. About a quarter (24%) prefer social media as a pathway to local news, higher than among U.S. adults overall (15%). And they are less likely to prefer print newspapers (8% vs. 13%).
When it comes to the primary access point for specific providers, Riverside-area residents are more likely to use social media when getting news from local newspapers (21% of Riverside residents vs. 13% of U.S. adults), TV stations (17% vs. 9%) and radio stations (15% vs. 7%).
There is no agreement among Riverside-area residents on their main source for local news, based on their responses to an open-ended question. Most prominent are Los Angeles-based TV station KTLA (6%), Palm Springs-based ABC affiliate KESQ (5%) and Los Angeles-based ABC affiliate ABC 7 (4%). (Riverside is part of both the Los Angeles and Palm Springs TV markets.) Beyond local TV, 3% name Victor Valley News Group and 2% name Riverside daily paper The Press-Enterprise.
Cincinnati, OH-KY-IN
See all results for the Cincinnati area.
Cincinnati-area residents give their local news media strikingly low marks for being connected to the community – but by and large do not use local providers at any lower rates.
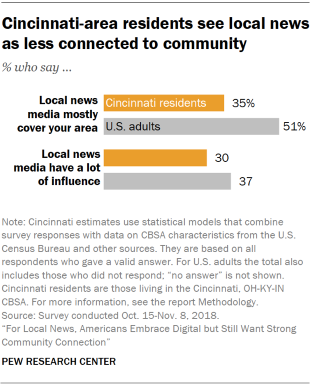
In Cincinnati, residents give their local news media lower marks on their community ties, particularly in terms of true local coverage. Only 35% of Cincinnati-area residents say their local news media mostly cover their area, compared with 51% of U.S. adults. In addition, three-in-ten Cincinnati residents say their local news media have a lot of influence on their community (vs. 37% of U.S. adults).
Cincinnati, OH-KY-IN CBSA
- 2.1 million residents
- Median age: 38
- Median annual household income: $56,861
- 32% have at least a college degree
- 12% black, 3% Hispanic, 80% white
- 14% of population in rural area
- 64% voter turnout in 2016
- 19% say they are very attached to the community
Note: Whites and blacks are single-race non-Hispanics. Hispanics are of any race. Source: Survey conducted Oct. 15-Nov. 8, 2018; Pew Research Center analysis of American Community Survey data and data from Dave Leip’s Atlas of U.S. Presidential Elections.
These concerns about connectedness translate to negative evaluations overall. When it comes to the different roles for local journalists, Cincinnati-area residents give lower marks for transparency (56% vs. 62% of U.S. adults), accuracy (64% vs. 71%) and thoroughness (59% vs. 65%).
While Cincinnati residents are less likely to follow local news very closely (22% do so, vs. 31% of U.S. adults), they are no less likely to often use a range of local providers, including TV and radio, though they do get news somewhat less often from the local daily paper (10% of Cincinnati-area residents do so often, vs. 17% of U.S. adults). They also show no differences when it comes to getting local news digitally.
Asked to name their main source of local news in an open-ended question, Cincinnati area residents primarily turn to local TV stations such as NBC affiliate WLWT (14% of Cincinnati-area residents say it is their main source), ABC affiliate WCPO (14%), CBS affiliate WKRC (13%) and Fox affiliate WXIX (10%). The local metro daily, The Cincinnati Enquirer, is named by 6%. In addition, 3% name suburban daily the Journal-News, while 2% name NPR.