Any local news system is inherently embedded within a particular community – and characteristics of communities vary extensively, according to data from the U.S. Census Bureau and other sources. Some have a larger share of young adults, driving down the median age, while others have a sizable senior population, driving the median up. Some have more racial or ethnic diversity than others, with substantial black or Hispanic populations. The share of people still living in homes without broadband internet access is larger in certain communities than others. And some areas have many lower-income households while others carry a great deal of wealth.
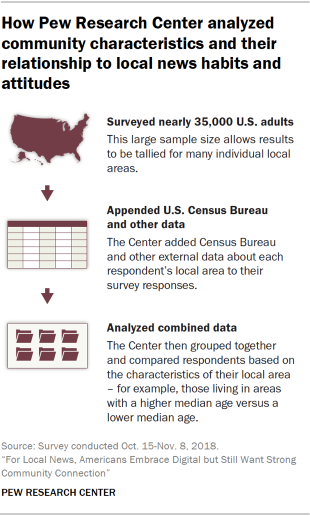
To explore how these differences relate to news habits, researchers grouped individuals based on the characteristics of their local area by adding Census Bureau data and other measures to the survey responses.
Researchers appended data from the U.S. Census Bureau and other sources to the individual responses and then classified individuals by the characteristics of their local area. Five specific characteristics were analyzed:
- Age groups communities based on the median age of all residents in the area, based on data from the 2012-2016 American Community Survey.
- Race/ethnicity groups communities that, based on data from the 2012-2016 American Community Survey, have a higher proportion of Hispanic, non-Hispanic black and non-Hispanic white residents.
- Income groups communities based on the median annual household income in the area, based on data from the 2012-2016 American Community Survey.
- Broadband access groups communities based on the proportion of households in the area, based on data from the 2013-2017 American Community Survey, that have landline broadband access through a hard-wired connection such as cable, fiber optics, and DSL (distinct from cellular or other wireless internet connections).
- Voter turnout groups communities that, based on 2016 presidential election results from Dave Leip’s Atlas of U.S. Presidential Elections, have a higher or lower proportion of their total population turn out to vote.
The geographic unit of measurement used here is what the U.S. federal government calls core-based statistical areas, or CBSAs. These are defined as a central city and the counties that are tied to it, such as the Los Angeles CBSA, which also includes Orange County to the south as well as Long Beach and Anaheim.
For the analysis, individuals are grouped together based the characteristics of their local area. For instance, researchers grouped together everyone who lived in CBSAs where voter turnout was above 64.434%. The criteria used to define the higher and lower group are given in the detailed tables below.
In making these groups, the goal was to examine communities that really stood out. As such, divisions were made so that the higher and lower groups are relatively small – roughly the top or bottom 10% of the U.S. population that live in a CBSA – while the middle group is large, often making up around eight-in-ten living in a CBSA. Given that the effects of community characteristics are largely indirect – as discussed below – this gives us the best chance at detecting their influence by minimizing the variation within each group.
The analysis finds that habits of and attitudes toward the local news media vary moderately based on these community characteristics. The differences may not be as dramatic or pervasive as one might think, due in large part to the natural mix of people that exists in any local area. Still, certain clear tendencies emerge.
Below are key findings of each community type examined, as well as an examination of differences by racial and ethnic makeup. The full data can be found in detailed tables that follow.
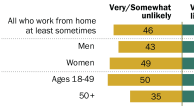
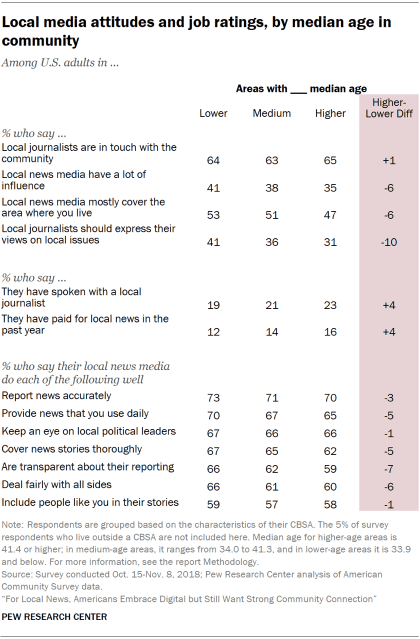
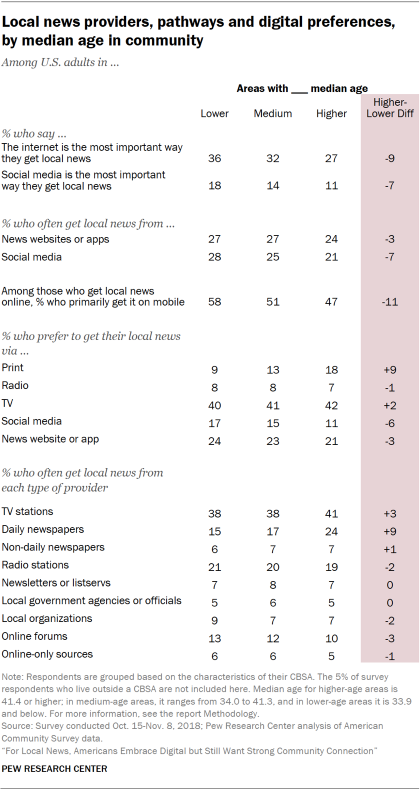
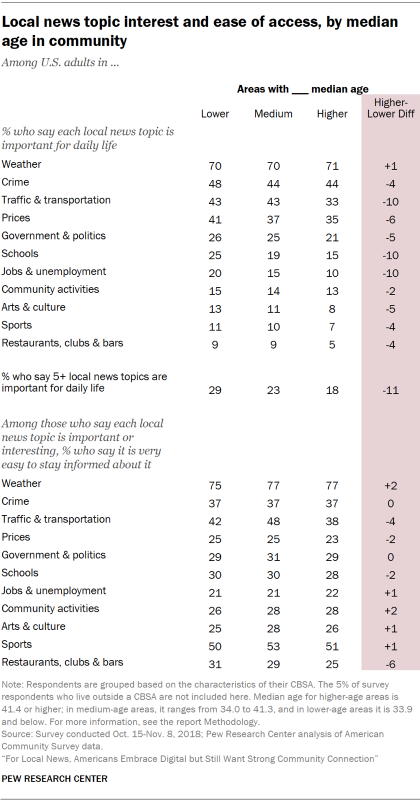
Age: Americans living in areas with lower median age stand out for their emphasis on digital pathways for local news. They are more likely than those living in areas with a higher median age to say the most important way they get local news is the internet (36% vs. 27% who live in areas with a higher median age) and social media specifically (18% vs. 11%). This is reflected in these areas’ lower reliance on daily newspapers (15% often get news from them, compared with 24% in areas with a higher median age). At the same time, individuals living in these younger areas see more topics as critical to follow daily: 29% say five or more topics are important for their daily life, compared with 18% of those in higher median age areas.
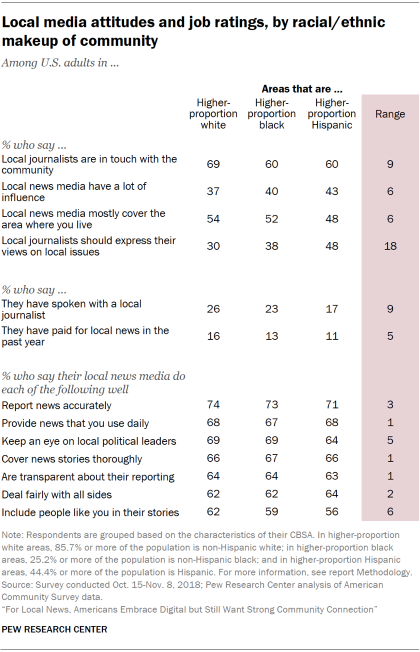
Race and ethnicity: Americans living in areas with higher proportions of blacks, higher proportions of Hispanics and higher proportions of whites differ notably in local news habits and attitudes. Residents of higher-proportion Hispanic areas stand out in saying their local journalists should express their views on local issues: 48% in these communities say so, compared with 38% in higher-proportion black communities and 30% in higher-proportion white communities. Residents in higher-share Hispanic areas are also more likely than those in higher-share white areas to view their local media as influential (43% vs. 37%; those in higher-share black areas fall in between at 40%). And residents of both higher-proportion black and Hispanic areas are less likely than those in higher-proportion white areas to say local journalists are in touch with their community. Those in both higher-share Hispanic and black areas place more importance on several local news topics than those in higher-share white areas. These topics include crime, traffic, changing prices, jobs, community activities and schools.
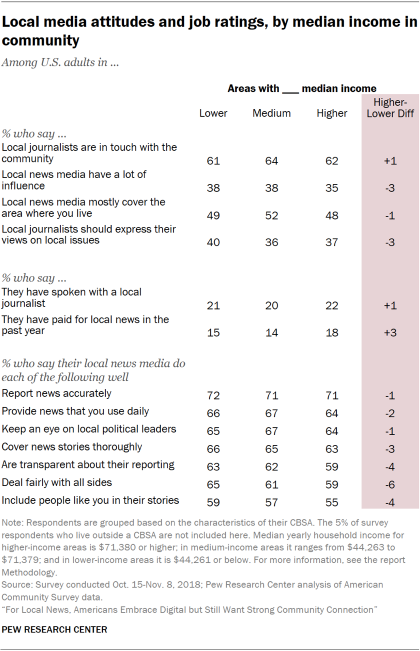
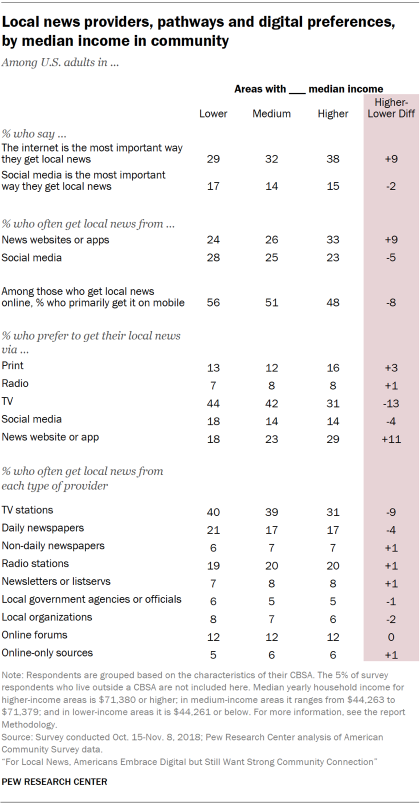
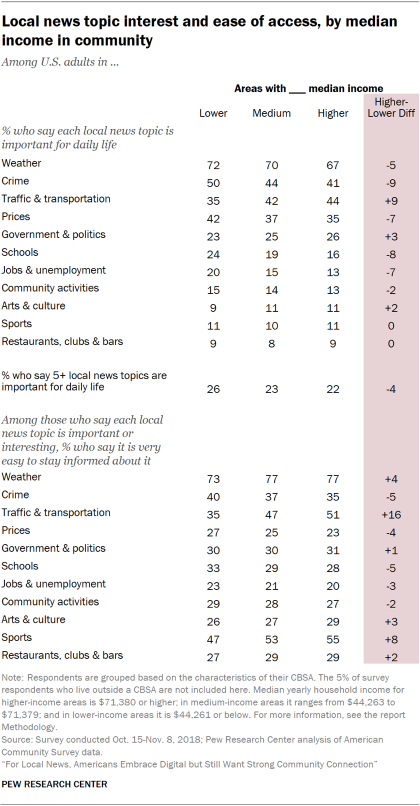
Income: Residents of areas with lower median income stand apart from those living in areas with higher median income for their greater reliance on television: 44% of residents prefer getting their local news through the TV set rather than through other pathways like print, compared with 31% of people in higher-income areas. These residents are also more likely to get online local news primarily on mobile devices (56% vs. 48% of those in higher median income areas) and from social media (28% get local news there often vs. 23% of those living in higher-income areas). Finally, those in lower-income areas express a greater need to get daily news on crime, changing prices, jobs and schools, while those in higher-income areas are more likely to say traffic and transportation news are critical.
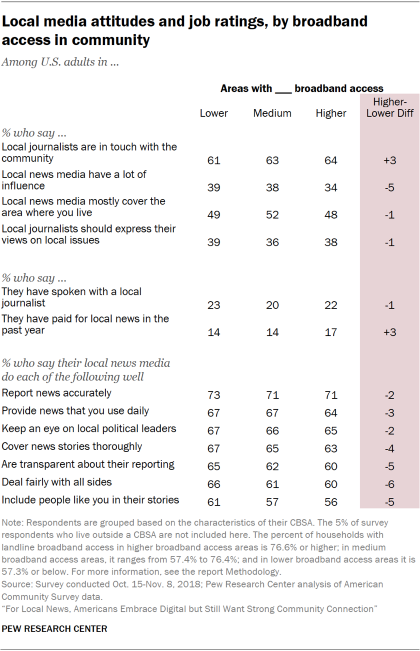
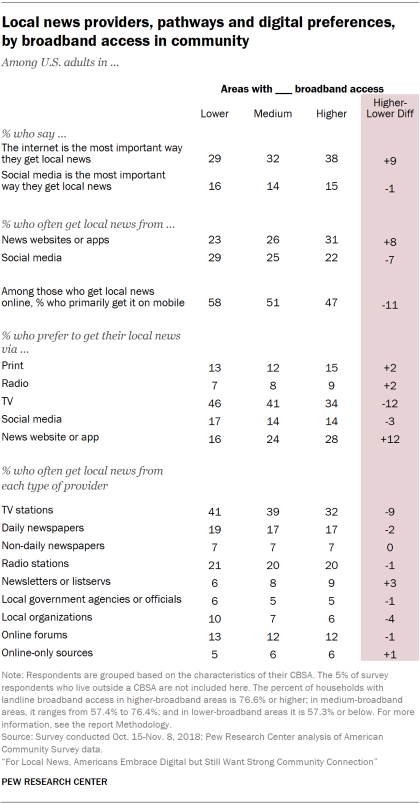
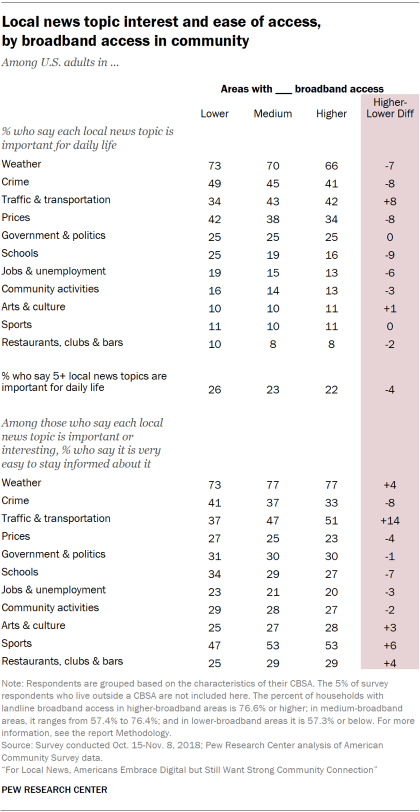
Broadband: Differences between residents living in areas with higher and lower access to broadband internet are very similar to differences by median household income, in part because of the high degree of crossover between the groups: 78% of those in communities with more broadband access are also in higher-income communities, and 65% in communities with less access are also in lower-income communities. As such, those in areas with less broadband access are more likely to prefer the TV as a pathway to local news and to primarily use mobile devices to access local news online. They also place more importance on crime, changing prices, jobs and schools.
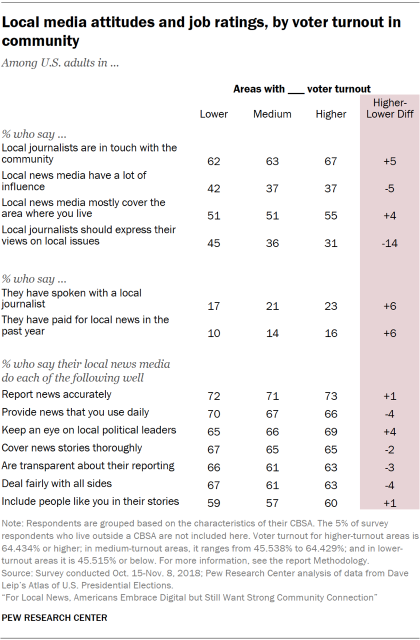
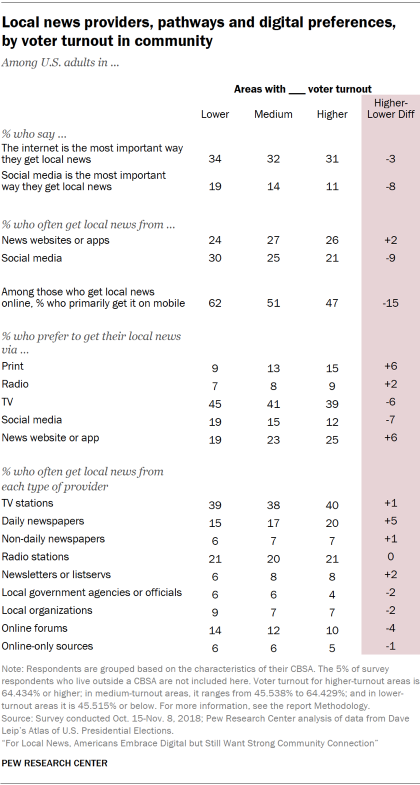
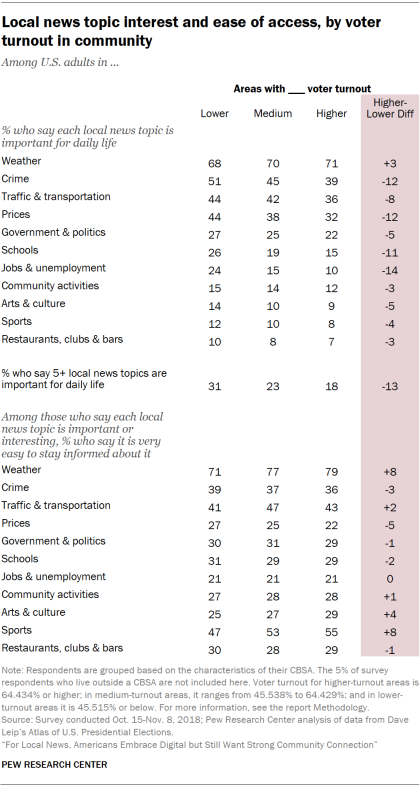
Voter turnout: Those who live in areas with lower voter turnout in the 2016 election see somewhat less community connection from their local media: They are less likely to say their local journalists are in touch with the community (62% say this vs. 67% of those in higher voter turnout areas) and less likely to have ever spoken with a local journalist (17% vs. 23% of those in higher-turnout areas). They also have a somewhat different idea about the appropriate role of their local journalists: 45% say local journalists should express their views on local issues, compared with 31% of those who live in areas with higher voter turnout. Those in lower turnout areas do, however, place more importance on a broader range of local news topics, with 31% saying five or more topics are important for daily life, compared with 18% of those in higher-turnout areas.
Those in higher-proportion Hispanic communities more accepting of journalists’ personal views on issues; those in higher-proportion black and Hispanic communities place more importance on social media for local news
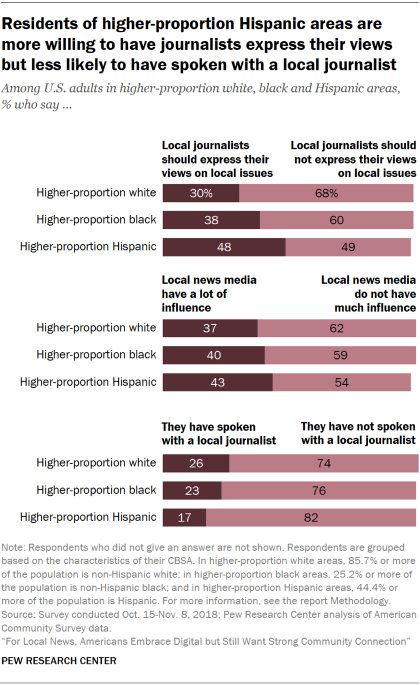
U.S. adults living in local areas with a higher proportion of Hispanic residents are much more likely to say that journalists should express their views on local issues (48%) than those in either higher-proportion white (30%) or black (38%) areas. They are also somewhat more likely to think the media have a lot of influence in their local communities (43%) than those in higher-share white (37%) areas.
Residents of higher-proportion Hispanic areas are also less likely than either of the other two groups to have ever spoken with a local journalist (17%, compared with 26% of those in higher-proportion white and 23% in higher-proportion black areas).
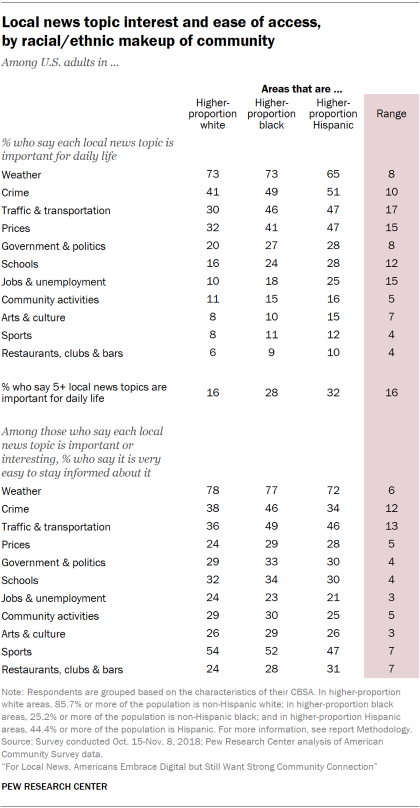
Those in higher-proportion Hispanic and black areas are distinct from higher-proportion white areas in the local news topics they value
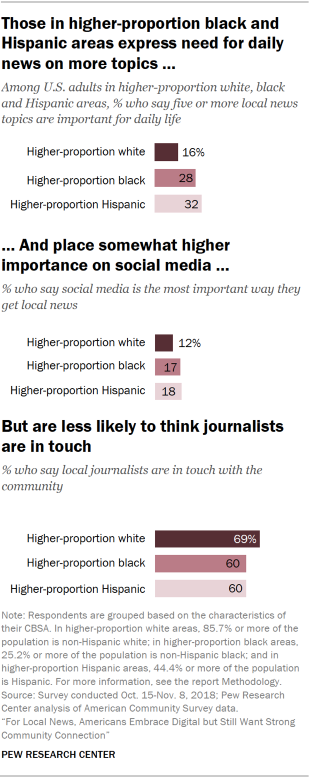
Americans living in communities with particularly high shares of Hispanics and of blacks are more likely to say most key local news topics are important for their daily lives than those in higher-proportion white areas. This includes crime news, changing prices and jobs. This difference also comes through in the total number of topics deemed to have daily importance. Americans living in higher-proportion Hispanic areas are the most likely to say five or more topics are important to follow for daily life (32%), followed by those in higher-share black areas (28%). Both outpace individuals in higher-share white areas (16%).
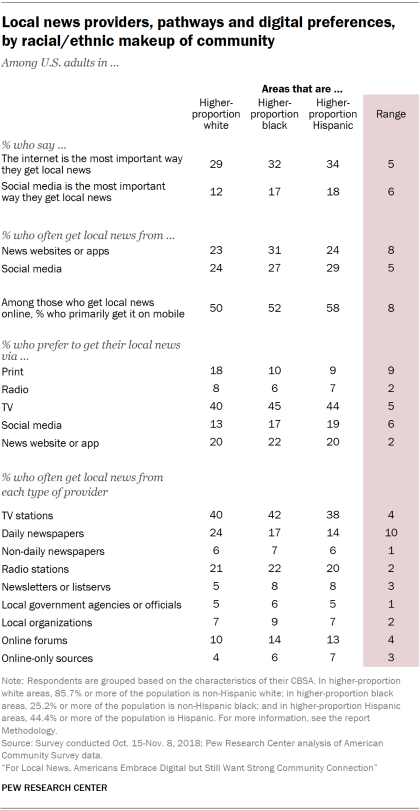
There are also some slight differences across community types in reliance on social media for news. Residents of higher-proportion Hispanic and black areas are more likely to see social media sites as the most important way to keep up with local news (18% and 17%, respectively, compared with 12% of those living in higher-proportion white areas).
At the same time, fewer residents of higher-proportion Hispanic or black areas think local journalists are in touch with their communities. Among residents of higher-proportion white areas, about seven-in-ten (69%) feel local journalists are in touch, while six-in-ten of those in higher-share black and Hispanic areas say this.
People in higher-proportion white areas show greater use of newspapers and non-digital formats
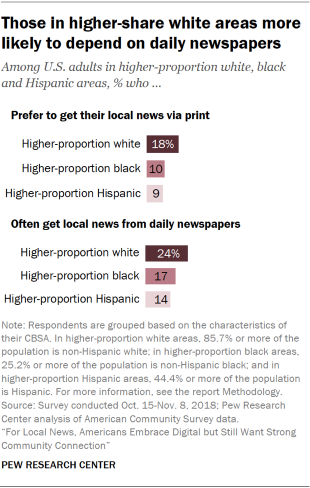
Those living in higher-proportion white areas are about twice as likely to prefer getting local news via print (18%) as those living in higher-proportion black (10%) or Hispanic (9%) areas. In addition, about a quarter (24%) of those living in higher-share white areas often get news from a local daily newspaper, more than those living in higher-proportion black (17%) and Hispanic (14%) areas.
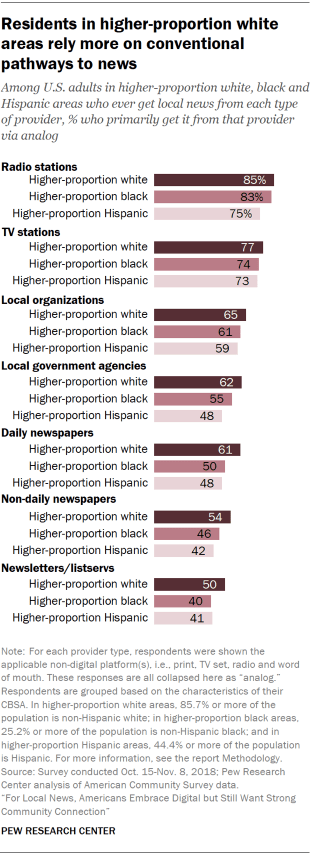
And when getting news from local news providers, U.S. adults in higher-proportion white areas show a distinct preference for more conventional formats, such as reading the print version of their local newspaper. For instance, those in higher-proportion white areas who get news from newsletters and listservs are more likely to prefer a print product to one on the web or social media than those in higher-proportion black or Hispanic areas.
In looking at these results, larger differences often exist between different types of people – the younger and older, adults with higher and lower incomes, etc. – than between different types of communities. For example, those in higher-proportion Hispanic communities were 18 percentage points more likely than those in higher-proportion white areas to say local journalists should express their opinions (48% vs. 30%). But Hispanic individuals – regardless of whether they live in a higher-proportion Hispanic area or elsewhere – were 27 points more likely to say this than white individuals.
This is to be expected. Communities are never as homogenous as the demographic group that researchers compile to profile differences in the population at large. Even in low-broadband communities, for instance, between a quarter and 57% of households still have high-speed broadband internet, and so an analysis of these low-broadband communities will still include a sizable portion of people that do have high-speed internet.
The influence of community characteristics on local news behaviors and attitudes is indirect: These characteristics influence something else that, in turn, influences these attitudes and behaviors. For example, local TV stations serving a community where fewer homes have broadband might put fewer resources into their digital offerings, resulting in less online local news in that community, and thus less interest among local residents in getting news online. In contrast, individuals who don’t have broadband internet might simply be unable to access news video or graphic-intensive online content, directly depressing their online news use. As such, community influences should be less than individual influences – but still very much present.
Detailed tables showing data by community characteristics
The tables below show how residents of different types of communities responded to selected questions from the survey.
Age 9
Race/ethnicity10
Income11
Broadband access 12
Voter turnout 13