
Survey
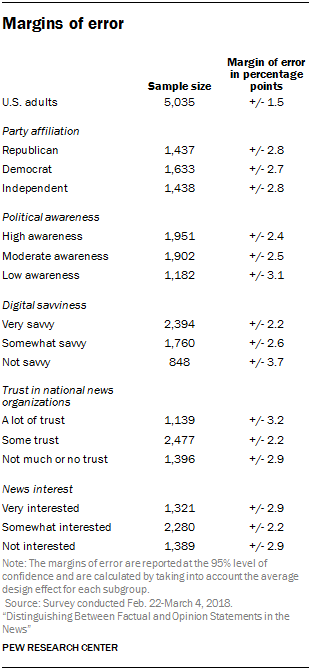
The analysis in this report is based on a nationally representative survey conducted from Feb. 22 to March 4, 2018, among a sample of 5,035 adults 18 years of age or older. The margin of error for the full sample is plus or minus 1.5 percentage points. This report was made possible by The Pew Charitable Trusts, which received support from the John S. and James L. Knight Foundation, the Ford Foundation, Bill & Melinda Gates Foundation and the Open Society Foundations. Support for the research is part of Knight Foundation’s Trust, Media and Democracy initiative, which aims to strengthen the role of strong, trusted journalism as essential to a healthy democracy.
The survey was conducted by the GfK Group in English and Spanish using KnowledgePanel, its nationally representative online research panel. KnowledgePanel members are recruited through probability sampling methods and include those with internet access and those who did not have internet access at the time of their recruitment (KnowledgePanel provides internet access for those who do not have it, and if needed, a device to access the internet when they join the panel). A combination of random-digit dialing (RDD) and address-based sampling (ABS) methodologies have been used to recruit panel members (in 2009 KnowledgePanel switched its sampling methodology for recruiting members from RDD to ABS).
KnowledgePanel continually recruits new panel members throughout the year to offset panel attrition as people leave the panel. All active members of the GfK panel were eligible for inclusion in this study. In all, 8,066 panelists were invited to take part in the survey. All sampled members received an initial email to notify them of the survey and provided a link to the survey questionnaire. Additional follow-up reminders were sent to those who had not responded as needed.
The final sample of 5,035 adults was weighted using an iterative technique that matches gender, age, race, Hispanic origin, education, region, household income, home ownership status and metropolitan area to the parameters of the Census Bureau’s March 2016 Current Population Survey (CPS). This weight is multiplied by an initial sampling or base weight that corrects for differences in the probability of selection of various segments of GfK’s sample and by a panel weight that adjusts for any biases due to nonresponse and noncoverage at the panel recruitment stage (using all of the parameters described above).
Sampling errors and statistical tests of significance take into account the effect of weighting at each of these stages.
The table shows the unweighted sample sizes and the error attributable to sampling that would be expected at the 95% confidence level.
Sample sizes and sampling errors for other subgroups are available upon request.
In addition to sampling error, one should bear in mind that question wording and practical difficulties in conducting surveys can introduce error or bias into the findings of opinion polls.
Pew Research Center is a nonprofit, tax-exempt 501(c)(3) organization and a subsidiary of the Pew Charitable Trusts, its primary funder.
© Pew Research Center, 2018
Assessing factual and opinion statements in the news
In this survey, respondents were provided with a series of statements and told that they came from news stories. For each statement, respondents were asked to categorize it as a factual or opinion statement. In a first module, respondents saw 12 statements. A second module included an additional eight statements, but unlike the first module, some statements were attributed to one of three news outlets. (For more information on the second set of statements, see the next section).
Asking respondents to categorize statements as factual or opinion
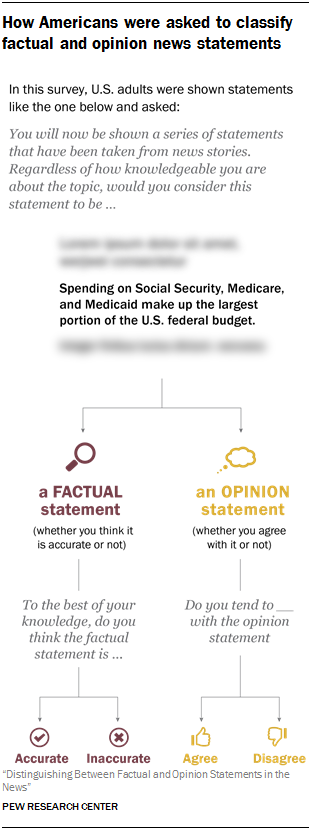
Respondents were asked to categorize each statement into one of two categories: a factual statement (regardless of whether it was accurate or inaccurate) or an opinion statement (whether they agree with it or not).
In other words, respondents were to choose the factual classification if they thought that the statement could be proved or disproved based on factual, objective evidence. They were to choose the opinion classification if they thought that the statement was based on the values and beliefs of the journalist or the source making the statement, and could not definitively be proved or disproved based on factual, objective evidence.
Each statement appeared in an image that was intended to look as if it were a quotation pulled from a news story.
After respondents classified a statement as either a factual or opinion statement, they were asked one of two follow-up questions. After a factual classification, they were asked if they thought the statement was accurate or inaccurate. After an opinion classification, they were asked if they agreed or disagreed with it.
Selecting the statements
The initial set of 12 statements included five factual, five opinion and two borderline statements developed by Pew Research Center analysts and subject-matter experts in conjunction with an external advisory board. Factual statements are unambiguous statements that one can prove to be accurate or inaccurate based on objective evidence. Opinion statements are based in people’s beliefs and values, whether political, religious, moral, cultural, or some other belief system, and therefore lack traditional standards of objectivity. And borderline statements have elements of both factual and opinion statements – they can be based in objective evidence, but claims are vague enough that they can neither be unambiguously proved nor disproved by factual evidence, in part because such evidence is often conflicting, incomplete, contested or involves making predictions.
Researchers used a multistep, deliberative process to construct and select the final statements used in the survey. The factual statements were drawn from a variety of sources, including news organizations, government sources, research organizations and fact-checking entities. The factual statements included only accurate – as opposed to inaccurate – statements that were fact-checked by the research team from primary data sources, fact-checking organizations and news stories, among other sources. The opinion statements were adapted largely from existing public opinion surveys on a range of topics. The borderline statements were inspired by the sources used to develop both the factual and opinion statements.
Next, a number of the statements were pretested using nonprobability online surveys to ensure that they would be understood by respondents. Lastly, the final set of statements was reviewed by Center subject matter experts and an external board of advisers with three goals in mind:
- Pull together statements that range across a variety of policy areas and current events (e.g., climate change, abortion, terrorism, immigration, democracy and elections).
- Strive for statements that were clearly factual and clearly opinion in nature (as well as some that combined both factual and opinion elements, referred to here as “borderline”).
- Include an equal number of statements that appealed to the ideological predispositions of the right and of the left, maintaining an overall ideological balance.
Researchers deliberately decided to include statements that lend support to the political views or policy position of each side of the political spectrum. In today’s polarized media environment, much of the news content has ideological appeal. For example, a 2017 Pew Research Center study that looked at how news organizations covered the beginning days of the Trump administration found that while outlets largely covered the same storylines, the tone of the coverage varied dramatically based on whether the outlet had a right-leaning, left-leaning or more mixed audience. With this in mind, statements in this study appealed to each side of the political spectrum to understand how Americans interpret statements that would mimic what people may see around contentious issues – that is, statements that are either true (in the case of the factual statements) or opinions, but nevertheless support an overall tone favoring one side or another.
A number of steps were taken to determine the ideological appeal of a statement. For the factual statements, existing literature on the political views of each side was pulled from various outlets and organizations. Factual statements that lend support to views held by more of those on one side of the ideological spectrum (and less of those on the other side) were classified as appealing to that side. Opinion statements were classified as appealing to one side if they were supported more so by one side in recent surveys. In addition, two “neutral” statements were included – one factual and one opinion statement – which were intended to appeal equally to the left and right. The borderline statements relied both on existing polling and other sources to determine whether each appealed to a particular policy narrative.
Attribution of statements to news outlets
A separate analysis tested the impact of attributing statements to news outlets on Americans’ ability to decipher factual statements from opinions. Respondents were provided with a second set of news statements, eight in all. These statements were all different from the initial 12 statements but were selected using the same criteria as noted above. There were three factual statements, three opinion statements and two borderline statements. Again, an equal number of statements appealed to the ideological predispositions of the left and right. This second set included one factual, one opinion, and one borderline statement that appealed to each side, as well as one neutral factual statement and one neutral opinion statement.
Respondents were asked to evaluate this second set of eight statements after the initial set of 12. The two sets of statements were separated by several other questions. (See the topline for more information on the placement of the two sets of statements.)
Attribution to news outlets
In the first set of statements, all respondents were told that each statement was “taken from news stories” but not attributed to a news source. However, in the second set of statements, some respondents saw statements attributed to specific news outlets. A quarter of respondents (N=1,260) saw all eight statements with no source attributed to them, while three-quarters (N=3,775) saw each attributed to one of three news outlets: Fox News Channel, The New York Times, or USA Today.
These three outlets were chosen to represent those that appeal to different audiences ideologically: one that appeals more to a right-leaning audience (Fox News Channel), one that appeals more to a left-leaning audience (The New York Times) and one with a mixed audience (USA Today). The audience composition of these three outlets was based on a Nov. 29 through Dec. 12, 2016, survey that asked respondents if they regularly got news about the 2016 presidential election from a number of outlets. The ideological leaning of an outlet’s audience was based on the portion of the audience who self-identifies as a liberal Democrat (including independents who lean Democratic) compared with the portion who identifies as a conservative Republican (including independents who lean Republican). The audience composition of The New York Times was 51% liberal Democrats, compared with 12% conservative Republicans. Fox News audience composition was 43% conservative Republicans and 10% liberal Democrats. USA Today’s audience composition was somewhat more mixed ideologically with 26% self-identifying as liberal Democrats and 16% as conservative Republicans. (See here for more information on the ideological composition and categorization of news outlets’ audiences.)
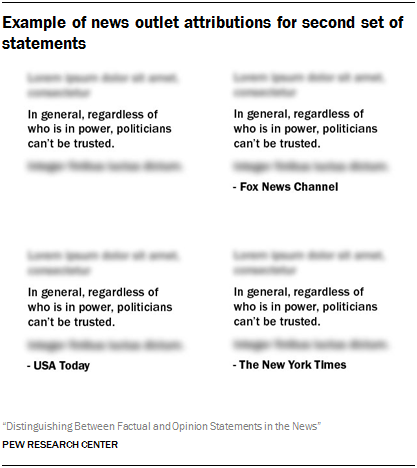
For those who saw the statements attributed to news outlets, each statement was randomly attributed to one of the three. Additionally, each respondent randomly saw three statements from two of the outlets and two from the third outlet. This was done so that each respondent saw a mix of outlets across the eight statements. The content of the statement and the visual appearance of the image looked exactly the same except for the news outlet attribution. The final layout of the source lines was based on best practices in company identification. The example below shows one of the statements across the four different attributions.
At the end of the survey, respondents who saw news statements attributed to the news outlets were told, “Please note that the statements that you were shown in this survey were part of an experiment and did not actually appear in news articles of the news organizations.” Those who did not see the statements attributed to the outlets were told, “Please note that the statements that you were shown in this survey were part of an experiment and did not actually appear in news articles.”
Analyzing the impact of news outlets
The framework used to analyze the influence of news outlets differs from that used for the initial set of 12 statements, in which none of the statements were attributed to a news outlet. In the analysis of the initial set, results were given as the percent of respondents who classified factual and opinion statements. Here, they are given as the percent of the time respondents classified statements.
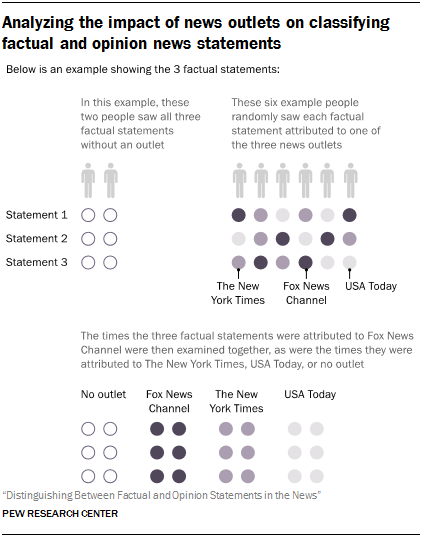
Since everyone who saw the statements attributed to news outlets saw a mix of all three outlets, it was not possible to break up respondents into discrete groups as was done for the initial set. Instead, this analysis grouped together all of the times the 5,035 respondents saw a statement attributed to each of the outlets or no outlet at all. The results, then, are framed as the percent of the time that respondents classified the factual, opinion and borderline statements as factual or opinion for each outlet. For example, for the three factual statements, we analyzed the percent of the time that respondents said they were factual when they were attributed to Fox News, The New York Times, USA Today or no outlet at all. The illustration shows how the data are organized for this analysis.


