This study focused primarily on the three main paths internet users take to get to the 26 most popular news websites: Direct visitors who either type a URL into the browser or use a bookmark; those who come through a query on a search engine; and those who get news by following links they see on Facebook.
Of the three, users who navigate directly to news sites provide the highest percentage of traffic to online news content. Direct visitors accounted for at least 20% of the total visitors to more than half (15) of the 26 sites studied. In contrast, search visitors accounted for at least 20% of the traffic to 11 of the sites. Facebook lagged behind, accounting for 20% or more of the visitors to only four sites.
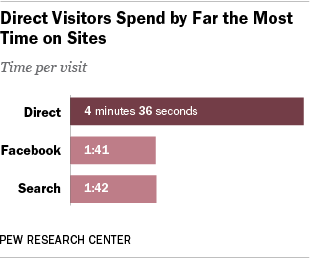
Users who navigate directly also deliver the highest levels of engagement on these sites, as measured by time spent, number of pages viewed and visits per month.

On average, users coming directly to these news sites spent 4 minutes and 36 seconds per visit. Facebook visitors spent 1 minute and 41 seconds on a site, almost three minutes less than the direct visitor. Visitors from search spent essentially the same amount of time as Facebook visitors: 1 minute and 42 seconds.
The differences were even more pronounced when it came to the number of pages viewed by visitors to news sites. Those coming directly averaged almost 25 pages (24.8) viewed per month. That is about five times the pages viewed by both search visitors (4.9) and by Facebook visitors (4.2 pages).
The same pattern emerged when it came to how often users returned to a site monthly. The average direct visitor made 10.9 visits per month, far more than the 3.1 visits from those coming via search and the 2.9 visits from Facebook referrals.
To some degree, these levels of engagement reflect the different user experiences connected to each type of path. Visitors using search engines tend to be looking for a particular story or content on a specific topic, and may be less concerned about the source of the story. On Facebook, news use tends to be more of a random and “incidental” experience. Indeed, only 16% of the Facebook users surveyed said that getting news was a major reason they go on the social media site, according to a fall 2013 Pew Research Center survey. News consumers who arrive on sites by typing in URLs or by clicking on bookmarks are likely to already have some connection with that news brand, which may explain the significantly higher levels of engagement.
Users Coming from Search or Facebook May not Stay Long or Return
The comScore data also suggest that whether a site has a large or small share of its traffic coming from a search or Facebook has little impact on how engaged that traffic remains with their content. Either way, those coming through these channels have engagement levels far lower than those coming to a site directly.
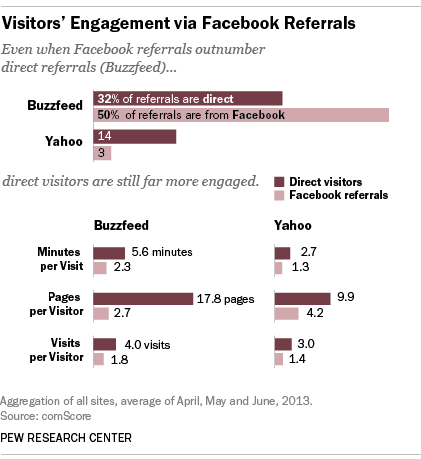
There is, for example, a diverse group of sites that received a far larger proportion of Facebook traffic than the overall group: mr.conservative (73%), buzzfeed.com (50%), npr.org (22%)3 and theblaze.com (20%).
But with the exception of the mr.conservative site—which is overwhelmingly dependent on Facebook traffic—Facebook visitors to those sites still showed far lower engagement than those coming in directly. (Facebook visitors to mr.conservative.com were the exception: They spent 2 minutes and 24 seconds, viewed 4.3 pages and made 1.8 visits – numbers that are very similar to direct traffic engagement there.)
In the case of Buzzfeed, Facebook visitors were on the site for less than half the time direct visitors spent, viewing about one-sixth as many pages.
In addition, Facebook visitors to sites with a large amount of Facebook traffic had similar engagement metrics compared to those coming to sites with relatively little Facebook traffic.
Yahoo! News, for example, had only 3% of its audience coming from Facebook. But it saw roughly the same engagement from its Facebook visitors as Buzzfeed, which was also far less robust than the engagement of direct visitors.
The same pattern holds true for visitors coming from a search engine. The size of a site’s search audience had little effect on engagement levels.
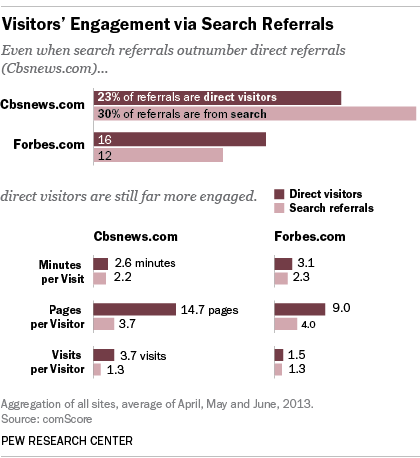
CBSnews.com had one of the highest proportions of visitors come from search, at 30%. But those search visitors viewed about one-quarter as many CBSnews.com pages as direct visitors, and came to this site only about one-third as often as the direct visitors.
Forbes—a site near the low end of search referred traffic (12%)—saw virtually the same engagement from search visitors as CBSnews.com. And search visitors to Forbes viewed less than half as many pages each month as direct visitors. That highlights another finding from the comScore data. The engagement levels of users coming to the 26 news sites from Facebook and search were quite similar, and stayed within a relatively narrow range.
Indeed, Facebook referred visitors to a large majority of the sites (23 of the 26 studied), where users spent between 1 minute and 12 seconds to 3 minutes and 12 seconds per visit – a range of just two minutes. On 23 of the 26 sites, Facebook visitors viewed between 1.3 and 3.3 pages per month, a difference of only two pages. And users attracted via Facebook referrals visited all 26 sites between 1.1 and 2.0 times a month.
The numbers were similar for visitors coming from search engines. Visitors to 24 of the 26 sites spent between 1 minute to 2 minutes and 30 seconds there—a 90-second gap. Search visitors viewed between 1.4 and 4.0 pages a month on 24 of those sites. And the range of visits was even narrower. For each of the 26 sites, search visitors came between 1.1 times and 1.8 times a month.
Engagement among Direct Users Does Vary
If engagement levels of Facebook and search visitors remain fairly consistent, the same is not true for those coming to news content directly. While some of these top news sites display higher levels of overall engagement than others, that variance is tied almost entirely to differences in engagement among the direct visitors.
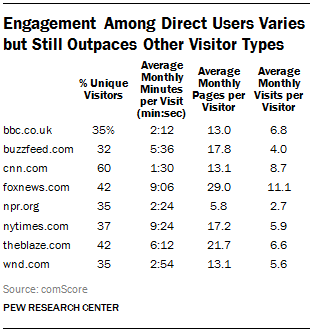
Overall, direct visitors to the 26 news sites examined in this report display a far wider range of engagement behaviors than do visitors from search or Facebook. Take, for example, the 10 sites with the highest percentage of visitors coming directly to the site. CNN tops the list with 60% direct traffic, whose visitors view on average 13 pages per month and return 8.7 times a month. But they stay for just 1 minute and 30 seconds per visit. This length of time is essentially the same as visitors coming to CNN.com from search or Facebook, and is much less time than direct visitors spend on Buzzfeed (5 minutes and 36 seconds), NYTimes.com (9 minutes and 24 seconds) or Foxnews.com (9 minutes and 6 seconds).
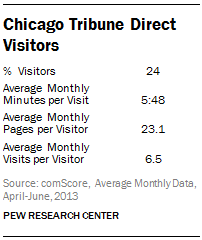
Conversely, chicagotribune.com gets 25% of its visitors directly. But that group views 23 pages per month, a far higher engagement level than for other sites—such as bbc.co.uk or npr.org—with a greater percentage of direct visitors.
The amount of minutes direct visitors average on a site ranged from 54 seconds (guardian.co.uk) to 17 minutes and 18 seconds (nydailynews.com). The number of pages viewed also varied widely—from 3.1 a month (examiner.com) to 52.6 (nydailynews.com).
And while the range of monthly visits to a site by those coming via Facebook or search was confined to between once and twice a month, direct visitors behaved very differently. On the low end were those who visited several sites (including forbes.com) as little as 1.5 times a month. On the high end were foxnews.com visitors who showed up more than 10 times as often (11.1 times per month).
Multiple Pathways to News?
Pew Research Center also examined the extent to which individuals entered one of these sites from more than one of the three main pathways: direct, Facebook and search. For example, what percent of search-referred visitors also come to the site directly at some point over the month? And how about vice versa? Are consumers, in other words, connecting with news organizations through more than one route?
These data reveal that at least on desktop/laptops, individuals tend to be one type of visitor or another. Among the sites studied, only between o.7% and 2.3% of direct visitors also came in via Facebook over the course of the month (with the exception of Buzzfeed for whom 11.3% of direct visitors also come in through Facebook). And only between 1.3% and 4.6% also came in via search (here, with the exception of The Examiner at 8.6%). Looked at another way, for the majority of sites studied (19 of the 26), more than three-quarters of their direct visitors only visited the site directly over the course of a month.
A similar pattern holds true for Facebook referrals. A majority of sites saw more than three-quarters of their Facebook referrals come in only that way, though the range of those also coming in directly varied a bit more: from a low of 4.4% to a high of 13.6% (again at Buzzfeed). Too few also entered via search to be measurable.
Again, these data do not include mobile traffic, which Facebook says now accounts for 48% of all users in a given day.4
Other Ways Visitors Arrive at Sites
While search, direct and Facebook are the main referral methods studied here, comScore’s broad category of “other” often represents the greatest portion of visitors to most sites. But it is a sprawling category that includes everything from email and websites operated by non-news entities to message boards and other news websites.
For most sites on this list, each of these sub-categories counts for such a small percentage of visitors that comScore does not break them out separately. But a few sites do stand out for the percentage of traffic they get from one of the “other” referral methods. Two of the digital general sites – news.msn.com and newsyahoo.com – get roughly three-quarters of their traffic from corporate sites (these are sites like nike.com or other websites of corporations). And gma.yahoo.com, the site for ABC’s “Good Morning America” program, gets 90% of its traffic via corporate sites.
That makes sense when you consider that all three are the digital news outlets for much larger corporate entities. In the case of news.msn.com (Microsoft) and news.yahoo.com (Yahoo!) users can arrive at these sites via virtually any of Microsoft’s or Yahoo!’s other products. In the comScore data, these visitors would be counted “corporate sites” referrals. For example, if a user signs out of his or her MSN or Yahoo! email accounts, they are taken to various sign out pages. In the case of Yahoo!, users are redirected to the Yahoo.com homepage, which features news.yahoo.com content. In some cases, users are taken directly to those sites. In fact, after a recent redesign of Microsoft’s email, a user with an MSN account could see news.msn.com content alongside the user’s email inbox.
At the same time, a few sites derived a significantly large percentage of traffic from other news websites. One is Breitbart.com, the digital political site founded by the late political activist Andrew Breitbart. The conservative news website got 42% of its traffic that way. Not far behind, at 33%, was Washingtontimes.com, the legacy print site with a conservative tilt. This inbound traffic from other news sites suggests news outlets like Breitbart and The Washington Times may be linked to on the pages of other like-minded media outlets.
Given the diversity of sub-types under comScore’s “other” category, it is challenging to make a direct comparison to other referral types. Taken as a group, these “other” visitors look very similar to users who come from search or Facebook. They are much less engaged than visitors who come directly, and there is little variation across sites.
A good example would be Examiner.com. The “other” category makes up 32% of the site’s total traffic, roughly in the middle of the list in terms of “other” audience size. Visitors coming to the site through those “other” paths spent 1 minute and 18 seconds on the site per visit; they viewed 2.2 pages per month, and returned 1.2 times. That is quite similar to visitors coming from search, who spend 1 minute and 30 seconds per visit on the site, view 2.2 pages, and visit 1.5 times per month – or those coming to Examiner.com from Facebook, who spend 1 minute and 24 seconds on the site, view 2.2 pages and return 1.4 times a month.
How Mobile Users Come to News Sites
As is the case for most major analytics companies, comScore’s panel of mobile users and total mobile traffic is too small to allow the same deep level of analysis that can be conducted with data from desktop and laptop computer use.
comScore was able to provide the total number of mobile visitors—those going to either the mobile browser or the mobile app—to each website in the sample during the three months studied. The browser numbers include data from any web-connected mobile device; while mobile app data reflect offerings in the iTunes and Google Play stores.5 The U.S. mobile panel is so much smaller than the U.S. desktop/laptop panel (14,000 versus 1 million) – restricting what can be learned because a smaller panel limits the weighting that can be done on specific sites, demographics groups or behavior traits.
NPR’s mobile traffic provides an example of this limitation. comScore had enough panelists visit NPR’s mobile browser to meet the threshold to collect and extrapolate data, but did not have enough panelists access the NPR mobile app . Thus, it did not break out mobile app traffic for the public radio site. However, NPR’s internal data shared with Pew Research shows that the news organization had 13 million app downloads across the Android and iOS platforms, making it one of the most downloaded news apps. Thus, while Pew Research finds that the mobile traffic data comScore does report is accurate, some sites’ app traffic may fall below the threshold of reportability because of the makeup of the panel.
Factoring in those limitations, three key findings do emerge. First, despite the growth in mobile phone and tablet use, the desktop still dominates the traffic to news sites. None of the 26 sites studied had more traffic come from a mobile device than from desktop, although some had a closer mix of traffic from desktop vs. mobile. This is in line with earlier research by the Pew Research Center’s Journalism Project, which found that (even among mobile news users) the desktop is still the primary device for web access.
Second, at the time of the study, only half of the news sites—13 of the 26—had a mobile app available for download in either the iTunes store or the Google Play Store, suggesting that many of the most popular sites have opted out of the app world so far.
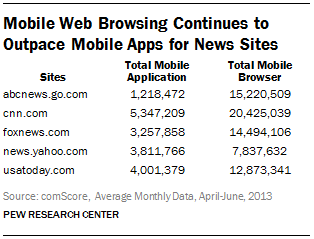
Of the 13 that had apps, only five (for the reason listed above) met comScore’s minimum threshold for reporting users: ABC News, CNN, Fox, USA Today, and Yahoo! News. All those apps are free to download in both the iTunes and Google Play stores, and are also among the top 20 most downloaded news apps in both stores. And the trend was clear. Among those five sites, there were still far more visits to the mobile web browser than to the mobile application.
This trend is in line with past reports by the Pew Research Center on the use of mobile browsers versus apps. A Fall 2012 report found that on a smartphone, 61% of mobile news users got news “mostly” from their mobile browsers vs. 28% “mostly” from apps (11% said both equally.) Tablet owners reported a similar pattern with 60% saying they “mostly” got news from their browser and 23% “mostly” from apps (16% said both equally).
Visitors Arriving through Facebook are Younger than Other Visitors
For the majority of sites studied here, visitors coming from Facebook were younger than visitors coming to the site directly or through search. This was true for both 18- to 24- year-olds and 25- to 34-year-olds.
For example, of the total audience to bbc.co.uk, 23% are in the 25-34 age group. Among Facebook visitors to that site, however, that number is 41% the highest of any site studied here. The second largest gap was on another British site, guardian.co.uk, which had 24% of its total audience in the 25- to 34- year-old age group, but 38% of its Facebook visitors in that bracket. NYTimes.com saw a similar pattern, with 22% of its overall audience in that age group and 35% of its Facebook audience in that 25-34 cohort.
Indeed, in 16 out of the 19 sites where comparisons could be made, Facebook sent a significantly higher percentage of 25- 34- year-old visitors than the direct path. And in 16 of the 17 sites that could be compared, Facebook sent higher percentages of 25- to 34- year-olds than search—often by very large margins.
In an even younger age group, 18- to 24- year-olds, the same pattern emerges, though it is less pronounced. Of the 18 sites where comparisons could be made, the percentage of 18- to 24- year-olds coming from Facebook was higher than those coming directly on 15 sites and higher than the search visitors on all 18.
Buzzfeed actually had the largest percentage of 18- to 24- year-olds referred from Facebook at 31%, but that was quite close to its overall audience, of which 28% are 18-24 year olds.
Other demographics, for most of the sites studied here, remained similar across the three pathways. The fact that audience demographics differed from one site to the next suggests that it is the site itself, rather than the pathway, which determines the demographic makeup of its visitors.
The News Sites Studied
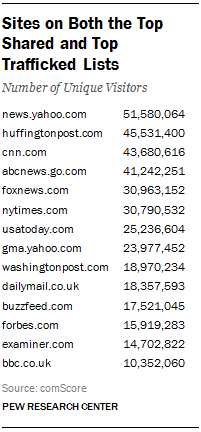
The 26 news sites studied in this report were identified from two separate lists: news sites generating the most monthly unique visitors, according to comScore measures from June 2013, and the news sites that were shared most often on Facebook, according to Facebook’s internal accounting during that same month.
Seventeen of the sites are operated by organizations with a legacy news outlet, while nine of them are digital native sites with no legacy component. Within the legacy category were two subgroups—nine legacy print outlets and eight legacy broadcast outlets. The digital category was broken down into five, digital general news sites and four, digital political sites. Most sites—14 of them—appeared on both lists—most visitors and most shared.
Only six of the most heavily trafficked news sites were not among the most shared on Facebook. They were nbcnews.com (about 43 million unique visitors a month), nydailynews.com (about 15 million), cbsnews.com (about 14 million), guardian.co.uk (about 12 million), news.msn.com (about 12 million) and chicagotribune.com (about 7 million).
On the other end of the spectrum are five sites that are among the most shared on Facebook, but do not rank among the most visited sites. All five are conservative-oriented news sites: theblaze.com, breitbart.com, washingtontimes.com, mrconservative.com, and wnd.com. These sites have relatively modest audiences, with mrconservative.com at the bottom of the list at 772,000 monthly unique visitors.
Indeed on average, the four, conservative digital political sites (excluding the legacy washingtontimes.com) got 22% of their traffic from Facebook referrals – far more than any other grouping of news sites.