With the election less than two weeks away, Americans are following the presidential campaign more closely on nearly every news platform than they were earlier in the year, including print newspapers. The biggest gains have come on the internet-both to the websites of traditional news sources and those native to the web.
Social media platforms such as Facebook, Twitter and YouTube are growing especially rapidly as a source of political news. The number of Americans who say they regularly go to these destinations to learn about the campaign has doubled since January. Even with that jump, however, these leading social media platforms are still turned to by a relatively limited number of Americans, about 17% in all, when those who mentioned at least one of those platforms are combined.
When asked which sources of campaign news had been “most useful,” nearly half of Americans named television in one of its various forms. Cable news was first on that list, named as the most useful source by 24%; a little more than a quarter volunteered various forms of the internet, while a third as many named local or national newspapers (8%) or radio (6%).
These are among the findings of a new survey of Americans about how they are learning about the election conducted October 18-21 among 1,005 adults nationwide by the Pew Research Center’s Project for Excellence in Journalism.
The numbers portray a diverse landscape in which no platform dominates as the place for politics, and the vast majority of Americans say they regularly rely on multiple platforms to get political information. Just 6% said they turn regularly to just one platform.
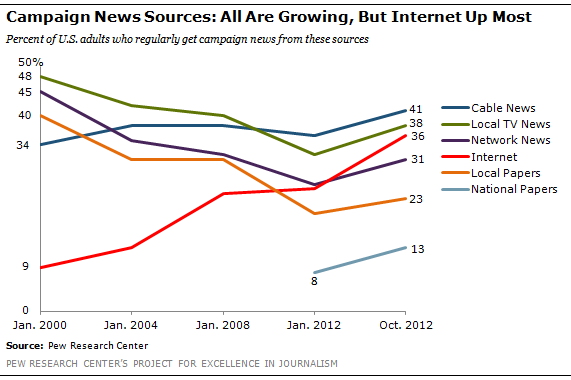
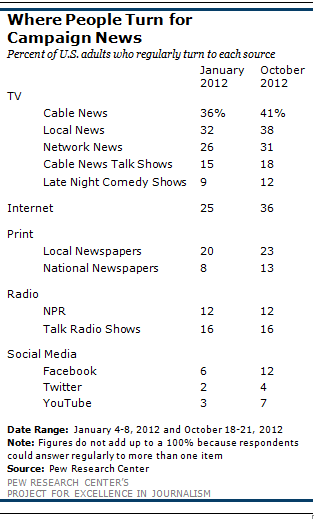
Cable news channels continue to have the furthest reach, but a number of other destinations are close. Currently, 41% of Americans say they regularly learn about the candidates or the campaign from cable news networks, up five percentage points from 36% during the primaries.
But local TV news is almost as popular as a means for learning about the campaign; 38% of Americans regularly use it to learn about the candidates and the election, up six points since the primaries.
That is now nearly matched by the internet, which has seen an increase of 11 points in the number of Americans who say they regularly turn to it for campaign news since the year began. Fully 36% of Americans say they regularly get election news there, up from 25% in January.
Yet nearly as many-31% of Americans-regularly get information about the candidates and the campaign from national evening network newscasts; it was 26% during the primaries.
Local and national newspapers have also seen their audiences grow. Altogether, 30% say they regularly read one of these two types of newspapers for campaign news; 23% regularly turn to their local daily newspapers, up from 20% in January; 13% turn to national newspapers, up from 8% in January.
The Pew Research Center traditionally asks Americans about their sources of campaign news at the beginning of each presidential election. Back in January, those surveys found that with contested primaries in just one party, the long-term declines seen in several traditional sources such as newspapers, local TV and network news had steepened.
The new survey was conducted to examine media consumption behavior about the campaign during the general election phase, both to benchmark that time period for the first time, and to see whether there were patterns in a changing media landscape.
Beyond traditional news sources and digital destinations, other forms of media have also established a role in the political information ecosystem, though some of these so-called alternative forms may have stabilized or even shrunk in popularity.
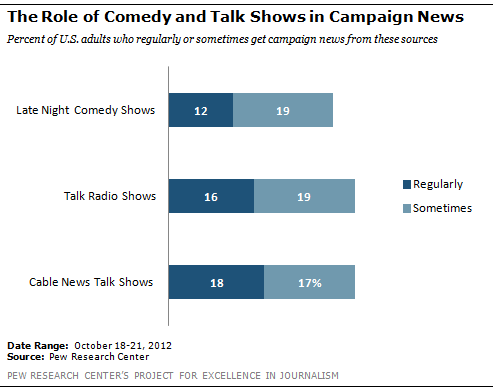
About one-in-ten Americans, 12%, regularly get news from comedy programs such as The Daily Show, Saturday Night Live or The Tonight Show with Jay Leno. Up from 9% in January, it is now on par with public radio and national newspapers.
Cable talk programs also play a sizable part in the political dialogue. Fully 18% said they regularly got political information there, up from 15% in January. But there is also evidence that role of cable talk might be smaller than it was some years ago. In January 2004, for instance, a combined total of 44% of Americans said they regularly or sometimes watched the shows for campaign information. In January, that number was 34%. Now it is 35%. Meanwhile, the percentage of Americans who said they never watch cable talk shows has risen from 38% in 2004 to 47% today. This possible downward trend in the broad audience for cable talk, moreover, stands in contrast to the trend for cable news in general, which has been among the most stable in audience reach of the older news platforms.
The number of Americans who say they turn to radio talk for campaign information also changed little from January and has declined from several years ago. In all, 16% said they regularly turn to figures such as Rush Limbaugh and Sean Hannity on the radio for election information, unchanged since the primaries. Another 19% do so sometimes, also unchanged from January. But in January 2004, 46% said they regularly or sometimes got campaign information from talk radio. The total now comes to 35%.
Where People Go Online for Election News
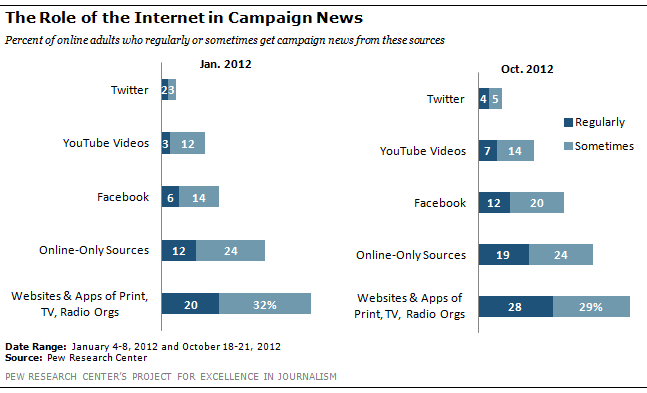
The survey then probed more deeply into where on the internet people go for campaign news on a regular basis. More said they turn to the websites or apps of traditional news organizations than to online-only sites or apps (28% of Americans who are online versus 19%).
And while social media, which draws on many sources for the information, remains relatively small, it is growing rapidly as a means for getting political news. Currently, 12% of those online say they regularly use Facebook to get campaign news, more than double the 6% who said so in January. That number represents 21% of those who use social networks.
YouTube is a regular source for campaign news for 7% of Americans, also more than double the 3% who said so in January, when the campaign involved primaries just in the GOP.
Twitter has also doubled to 4%, but remains the smallest of the three main social media formats. But when those on Twitter are asked about whether they use the platform for campaign news, the numbers become much larger. Fully 25% of those on Twitter use it regularly for campaign news. In January, 17% of those on Twitter used it regularly for political information.
Which Sources Are Most Useful
With such a complex network of platforms and sources to choose from, the nuance of how and when people seek out different places for information about the election becomes much more difficult to understand. The concept of a primary source of news-a gatekeeper that provides most of what a voter might know-seems obsolete.
To get at some sense of value, the survey asked people to name the source, out of those they turned to regularly, which had been “most helpful” to them overall.
The answers showed the continuing power of television in general to let people see events, but also the increasing influence of convenience, breadth and depth of the web.
In all, 49% volunteered some form of television as their most helpful source in providing campaign news, combining local, network and cable together. Cable led the way among these, with fully 26% of Americans naming cable news in general (24%) or cable talk shows in particular (2%). The other two major television sources-network nightly newscasts and local TV news-were both mentioned as most helpful by 11%.
About half as many as named a television source mentioned an internet one (28%). That puts the internet in a tie with cable news as the most helpful medium for campaign news.
Most of these people volunteered the internet in general as the medium they consider most helpful, but some specified particular destinations; 4% mentioned Facebook, 3% the websites of traditional news organizations, 2% web-only sources, and 1% YouTube videos or Twitter.
Newspapers were named by just 8% of Americans as the most helpful source for learning about the candidates and the election (5% said local papers and 3% said national ones).
And 4% mentioned public radio as the most helpful source for learning about the campaign.
Comedy programs were tied with Twitter and YouTube at 1%.
About the Survey
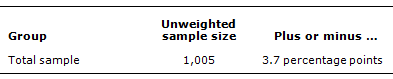
The analysis in this report is based on telephone interviews conducted October 18-21, 2012, among a national sample of 1,005 adults 18 years of age or older living in the continental United States (601 respondents were interviewed on a landline telephone, and 404 were interviewed on a cell phone, including 224 who had no landline telephone). The survey was conducted by interviewers at Princeton Data Source under the direction of Princeton Survey Research Associates International. A combination of landline and cell phone random digit dial samples were used; both samples were provided by Survey Sampling International. Interviews were conducted in English. Respondents in the landline sample were selected by randomly asking for the youngest adult male or female who is now at home. Interviews in the cell sample were conducted with the person who answered the phone, if that person was an adult 18 years of age or older. For detailed information about our survey methodology, see: http://pewresearch.org/pewresearch-org/politics/methodology/.
The combined landline and cell phone sample are weighted using an iterative technique that matches gender, age, education, race, Hispanic origin and region to parameters from the March 2011 Census Bureau’s Current Population Survey and population density to parameters from the Decennial Census. The sample also is weighted to match current patterns of telephone status, based on extrapolations from the 2011 National Health Interview Survey. The weighting procedure also accounts for the fact that respondents with both landline and cell phones have a greater probability of being included in the combined sample and adjusts for household size among respondents with a landline phone. Sampling errors and statistical tests of significance take into account the effect of weighting. The following table shows the unweighted sample sizes and the error attributable to sampling that would be expected at the 95% level of confidence for different groups in the survey:
Sample sizes and sampling errors for other subgroups are available upon request.
In addition to sampling error, one should bear in mind that question wording and practical difficulties in conducting surveys can introduce error or bias into the findings of opinion polls.