
A living database of political communication
In 2015, Pew Research Center launched an initiative to study political rhetoric on a large scale by building an ever-expanding database of political social media activity across multiple platforms, starting with Facebook and now including Twitter. To support this effort, researchers have spent hundreds of hours collecting, cleaning and validating this data. As of July 7, 2020, the database includes 2,965 Facebook accounts and 2,006 Twitter accounts maintained by 4,655 different U.S. politicians, including members of Congress, governors, state officials, and many of their primary and general election challengers. This analysis focuses on elected members of Congress since 2015, but all of the data preparation and cleaning procedures described in this methodology were conducted across the entire database where applicable, with the intention of developing generalizable procedures that can be applied in the future to new or expanded data.
Social media is near-ubiquitous among members of Congress, and the typical (median) member maintains two accounts on each platform (usually one official account and one personal or campaign account).1 In total, these members produce an enormous volume of social media content.
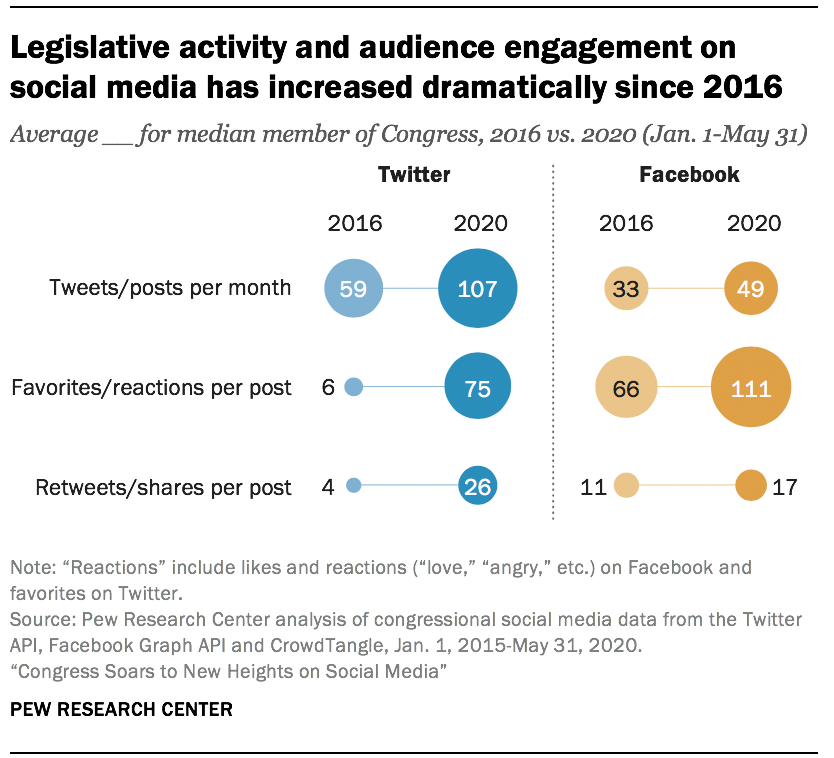
In the first five months of 2020, members of Congress have collectively produced an average of 73,924 tweets and 33,493 Facebook posts each month, generating a total of over 476 million reactions and favorites and over 112 million shares and retweets in the year to date.
Individually, members of Congress now post more content to Facebook and Twitter than was true four years ago. Comparing the first five months of 2020 to a similar period in 2016, the median member of Congress created 16 more Facebook posts (an increase of 48%) and 48 more tweets (an 81% increase) per month. On average, these posts also received substantially more audience engagement, whether measured by reactions and favorites or by shares and retweets.
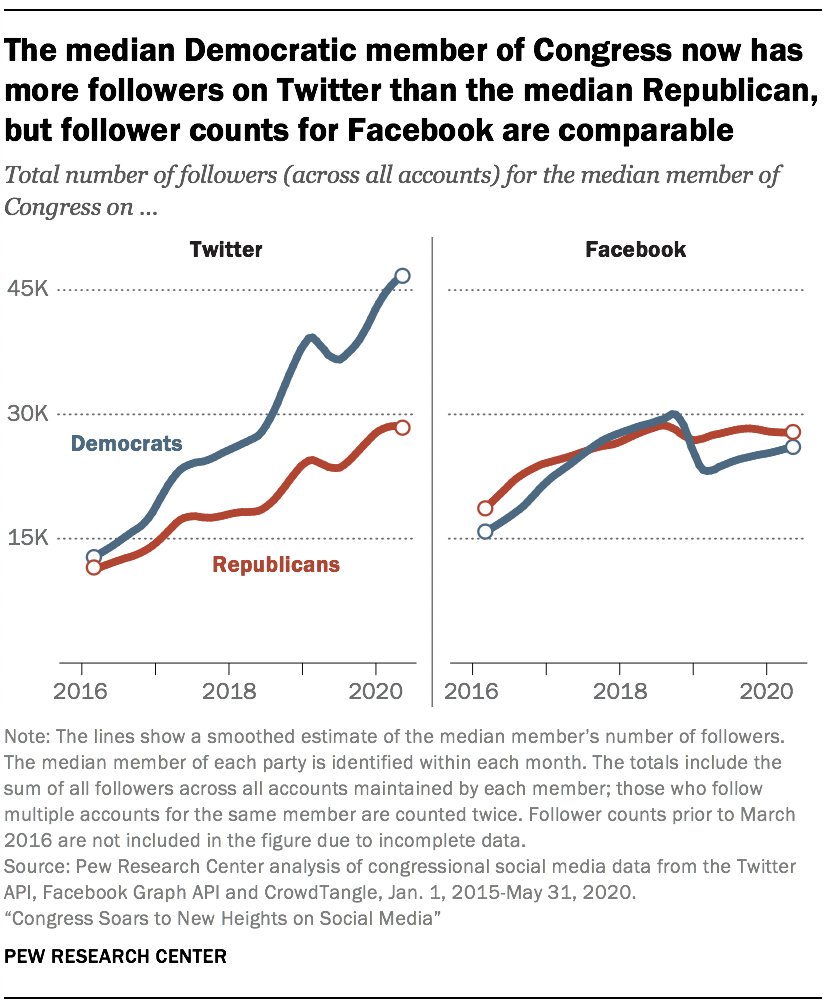
The median Democratic member posts more and has more followers than the median Republican on Twitter; partisan differences on Facebook are more modest
[6. Followers are calculated based on the total followers across all of a politician’s accounts, using the highest total number of followers that was observed during the first five months of 2020.]
As recently as 2016, the typical Democrat and the typical Republican had roughly comparable numbers of followers on both Twitter and Facebook. The follower counts of both parties have greatly increased since then, but on Twitter the number of followers for the typical Democrat has increased much more rapidly than for the typical Republican. The median Democratic member of Congress now has over 17,000 more Twitter followers than the median Republican.
By contrast, members of both parties have seen their Facebook audiences grow at a similar rate, and the typical Republican and Democrat now have about 10,000 more Facebook followers than did their counterparts in the 114th Congress in 2016.
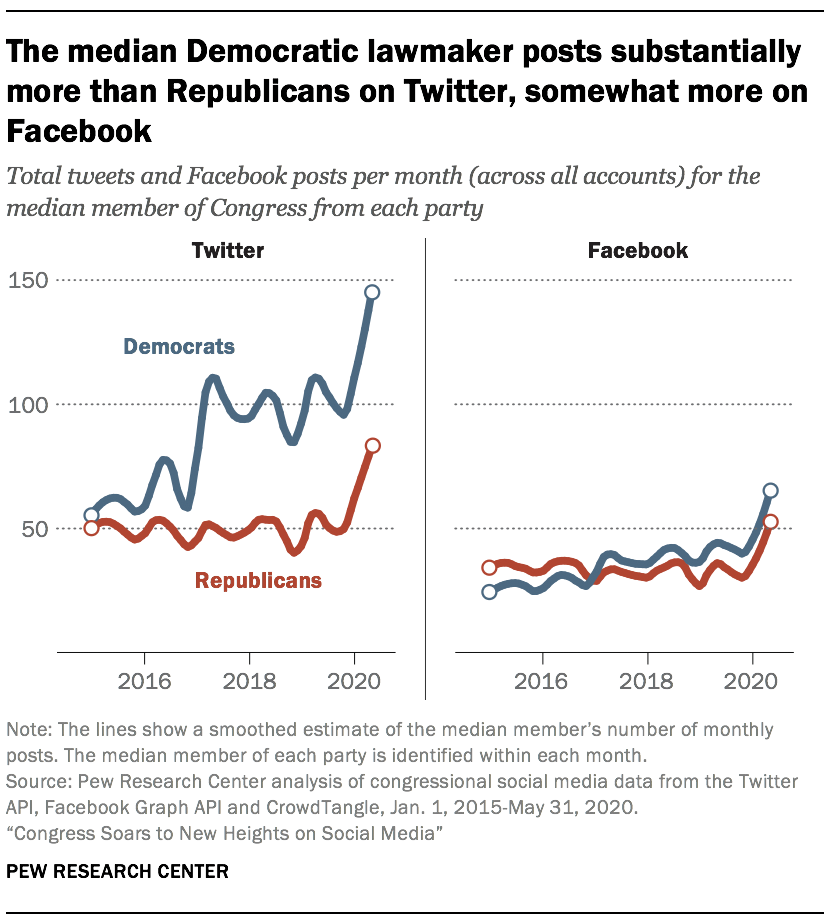
Members of both parties also post more regularly on both platforms than was true in 2016. The median Democratic member of Congress increased their monthly total posts in late 2016 and early 2017, coinciding with the election and inauguration of President Donald Trump. The typical Republican did not increase their posting quantity during that time, but members of both parties have since seen a similar increase in their social media activity following prominent events like the impeachment of Trump and the emergence of the COVID-19 pandemic. Comparing the first five months of 2020 with the same period in 2019, the typical member of Congress (inclusive of both parties) has increased their posting activity by 34% on Twitter and 29% on Facebook in 2020.
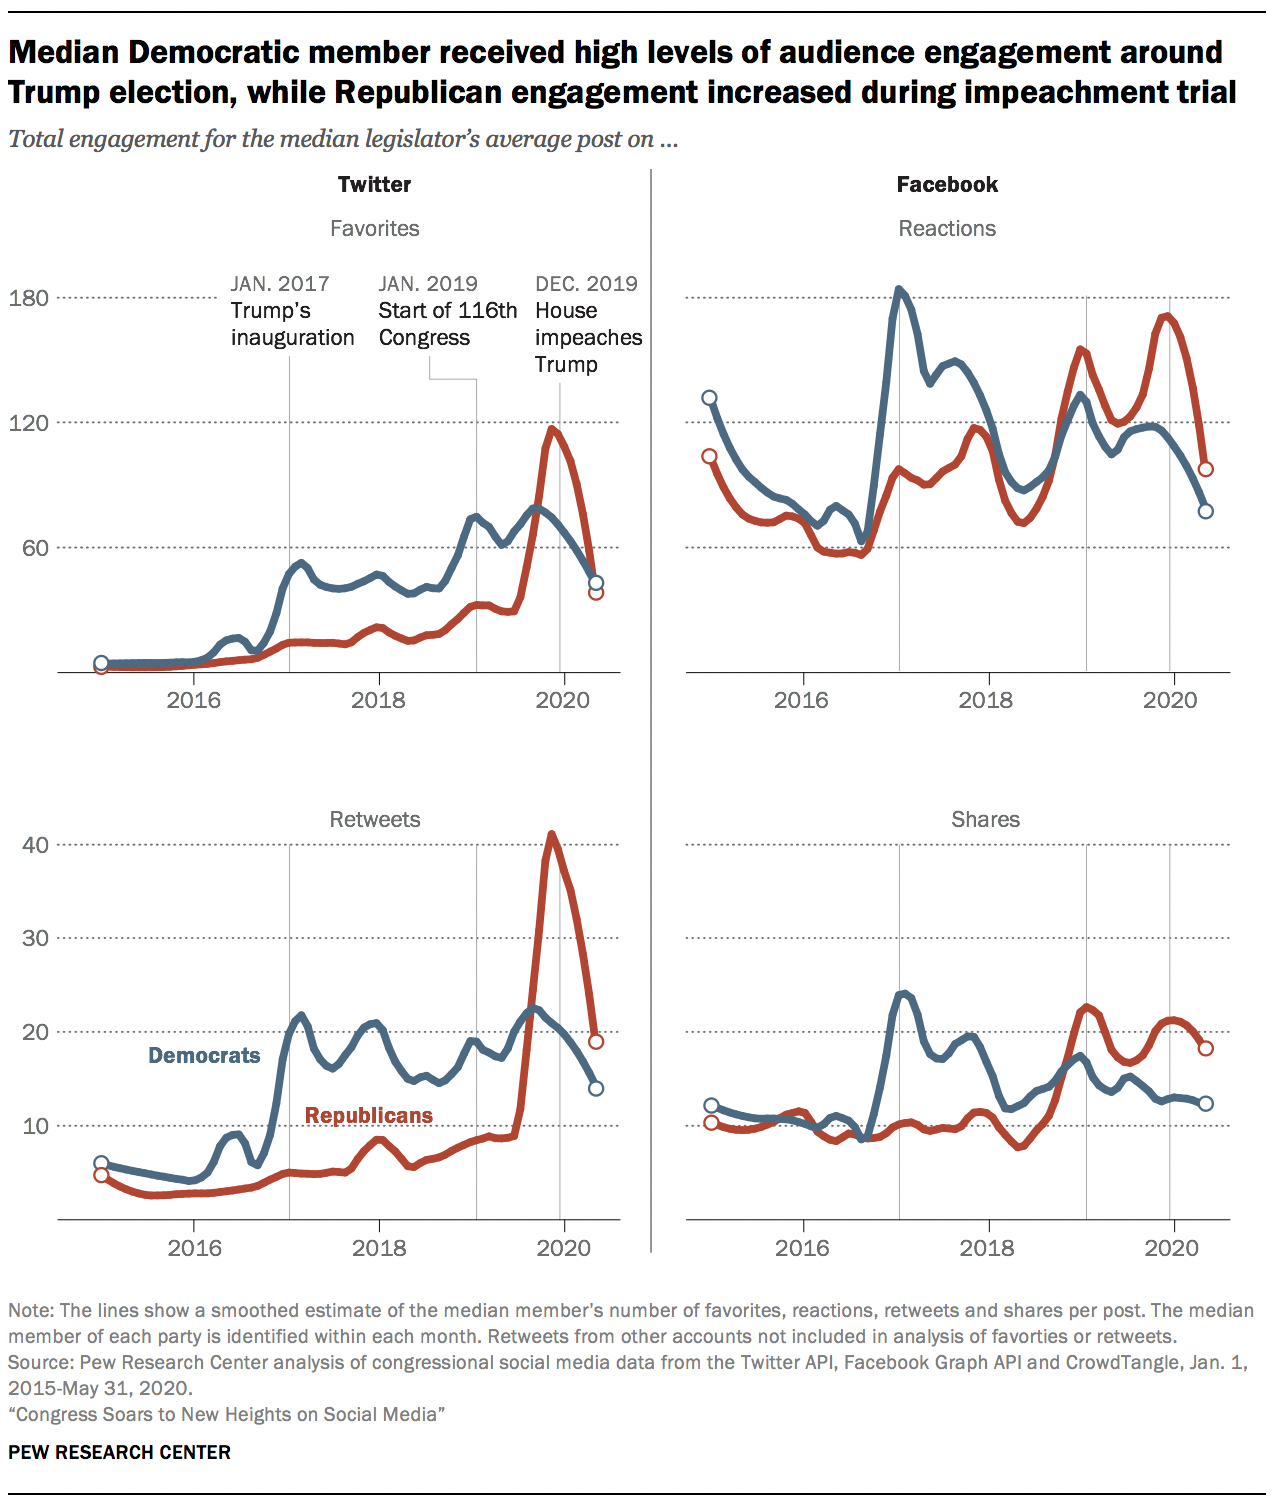
Audience engagement with the typical member’s social media posts has fluctuated over time
Public engagement with social media posts from lawmakers in both parties has waxed and waned in response to events in the broader environment. At the level of the typical member, Democrats saw a sharp increase in the number of favorites, reactions, retweets and shares received by their average post on both platforms after Trump took office, rapidly eclipsing engagement with Republicans’ posts. This increase in engagement has since diminished since its peak in January 2017, but engagement for the median Democrat remains notably higher than it was during the Obama presidency.
On the other hand, audience engagement with the median Republican member’s posts has increased on both Twitter and Facebook during much of Trump’s first term in office. Although Democratic posts typically received more engagement across most of the study period, Republican lawmakers have since closed the gap. In October 2018, the typical Republican’s average Facebook post began receiving more engagement than the typical Democrat’s Facebook post for the first time, a trend that has persisted since then.
Republicans achieved a similar benchmark on Twitter a year later, in October 2019. Engagement with posts from Republican lawmakers reached an all-time high on both platforms during Trump’s impeachment trial, in December 2019 through January 2020. In the first five months of 2020, the typical Republican’s average post received 67 more reactions and 11 more shares on Facebook – as well as 86 more favorites and 30 more retweets on Twitter – compared with the same period in 2016.
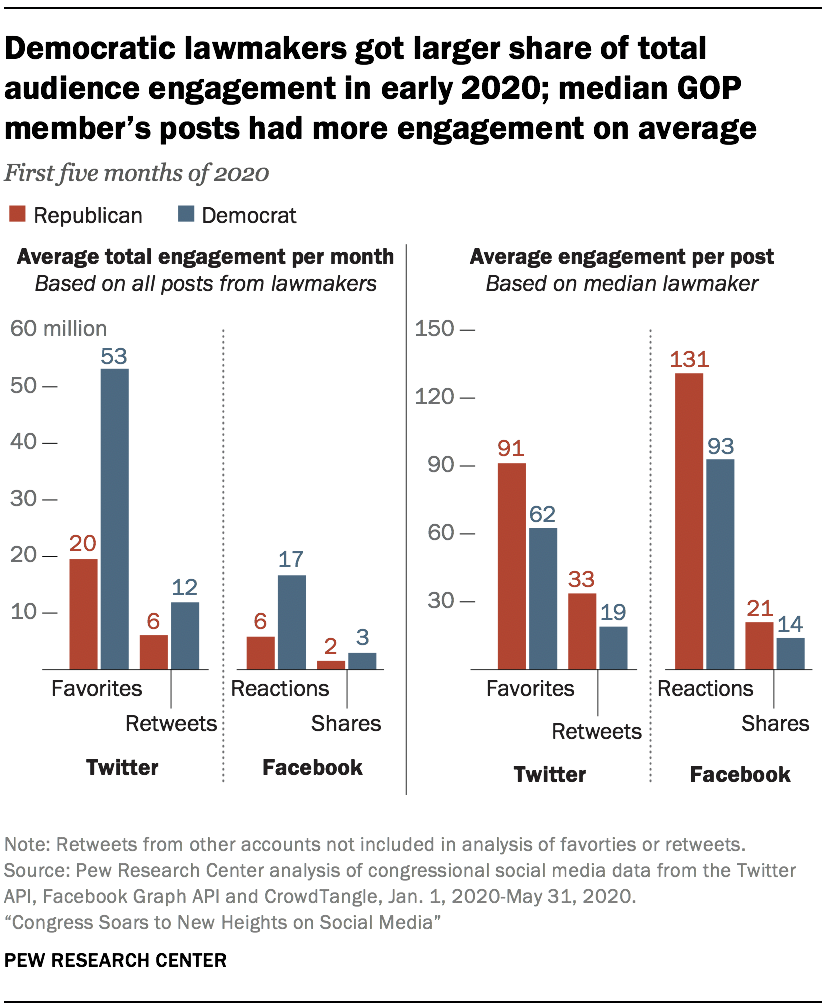
Looking more broadly at the year 2020 through May 31, the typical Republican’s posts have generated more engagement than the typical Democrat’s on both platforms – a pattern that is otherwise obscured when viewing this data in the aggregate. While Democratic members as a whole generate more audience engagement on both platforms, this is largely due to the fact that they produce more content and have a greater number of high-follower accounts. But when it comes to the typical lawmaker, Republicans tend to receive more engagement than Democrats on average. On Twitter, the median Republican’s average post has generated 91 favorites and 33 retweets, compared with 62 favorites and 19 retweets for the median Democrat. On Facebook, the differences are equally pronounced: 131 reactions and 21 shares on average for the typical Republican, compared with 93 reactions and 14 shares for the typical Democratic member.
A small number of congressional social media stars drive bulk of audience engagement
Previous Pew Research Center studies have highlighted the extent to which small groups of power users tend to dominate the discussion on social media, and this broader trend is also true of congressional social media activity specifically. A small number of very popular politicians receive the lion’s share of audience engagement (based on reactions as well as shares and retweets) on both Facebook and Twitter.
To conduct this analysis, researchers from the Center identified the 10% of members of the 116th Congress with the largest number of followers across all of their accounts on Facebook, as well as on Twitter.2 The median member of this group has 937,377 followers on Twitter and 401,004 on Facebook, an order of magnitude larger than the median member of Congress in the other 90% of all members (who has 36,135 followers on Twitter and 24,387 on Facebook).
Perhaps unsurprisingly, many members of Congress who previously ran for president – such as Republican Sens. Mitt Romney of Utah and Ted Cruz of Texas, or Democratic Sens. Bernie Sanders (a Vermont independent who caucuses with Democrats) and Elizabeth Warren of Massachusetts – have especially large social media followings. But a number of relatively junior members, such as Reps. Dan Crenshaw of Texas and Alexandria Ocasio-Cortez of New York, have amassed followings that place them squarely among the most popular members of Congress as measured by their audience on social media. (See Appendix A for a table of the most-followed Democrats and Republicans on both Twitter and Facebook.)
These popular members are slightly more active than the remaining 90% of lawmakers on each platform. Since January 2019, the top 10% of members by follower count generated 17% of all tweets and 15% of all Facebook posts from members of Congress. But this group receives a vastly disproportionate share of audience engagement. On Facebook, 78% of all reactions and 81% of all shares went to posts from accounts in the top 10% based on follower counts. The pattern is similar on Twitter, where the top 10% of members by follower count received 84% of favorites and 81% of retweets.
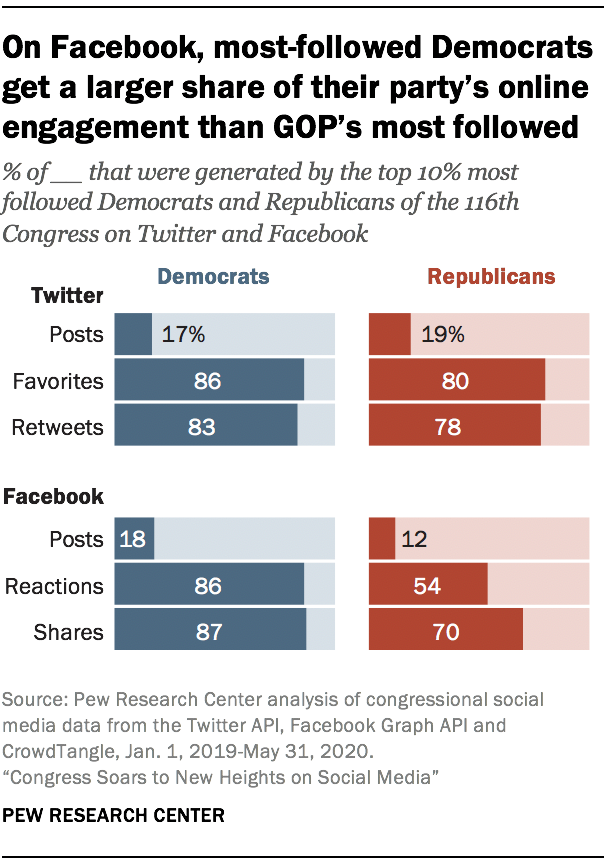
Researchers also separately identified the 10% most followed members within each party.3 On Twitter, the top 10% of most-followed Republican and Democratic members are responsible for a comparable share of their parties’ favorites (80% and 86%, respectively) and retweets (78% and 83%). But on Facebook, the top 10% of Democratic legislators produce a greater share of the party’s reactions and shares than is true of the top 10% of Republicans. The 10% most popular Democrats generate 86% and 87% of the party’s reactions and shares, respectively, while the most popular Republicans are responsible for only 54% of the party’s reactions and 70% of its shares.
Put differently, audience engagement for members of Congress on Facebook is more broadly distributed among Republicans than among Democrats. This appears to be true even after accounting for the fact that the top 10% of Republicans are responsible for a smaller share of the party’s total posts than are top Democrats (12% vs. 18%); at the post level, the median Republican receives more engagement than the typical Democrat on the platform.
