
How we did this
To conduct this analysis, Pew Research Center collected every Facebook post and tweet created by every official and unofficial account maintained by every voting member of the U.S. Senate and House of Representatives between Jan. 1, 2015, and May 31, 2020. The resulting dataset contains nearly 1.5 million Facebook posts from 1,388 congressional Facebook accounts and over 3.3 million tweets from 1,362 congressional Twitter accounts.
Researchers identified every account used by members of Congress by building upon a preexisting list with original searches. The analysis includes official, campaign and personal accounts, all of which are public-facing and can be followed or viewed by any user on these platforms. After identifying the accounts, researchers used the Facebook Graph API, the Twitter API and CrowdTangle (a public insights tool owned by Facebook) to download the posts. Finally, the team used a variety of methods to identify duplicate posts and process the data for analysis. These steps are described in greater detail in the report Methodology.
As social media platforms like Facebook and Twitter have become ingrained in political and popular culture, a new Pew Research Center analysis of every tweet and Facebook post from members of Congress since 2015 finds that the congressional social media landscape has undergone vast changes in recent years.
These shifts have been especially pronounced on Twitter. Compared with a similar time period in 2016, the typical member of Congress now tweets nearly twice as often (81% more), has nearly three times as many followers and receives more than six times as many retweets on their average post. On Facebook, the typical member of Congress produces 48% more posts and has increased their total number of followers and average shares by half.1
Social media use by members of Congress – and the online audience’s response to those communications – fluctuates in real time and varies based on the issues and events of the day. But underlying this constant churn, there have been notable changes in how lawmakers of each party use social media and interact with the Twitter and Facebook audiences more broadly.
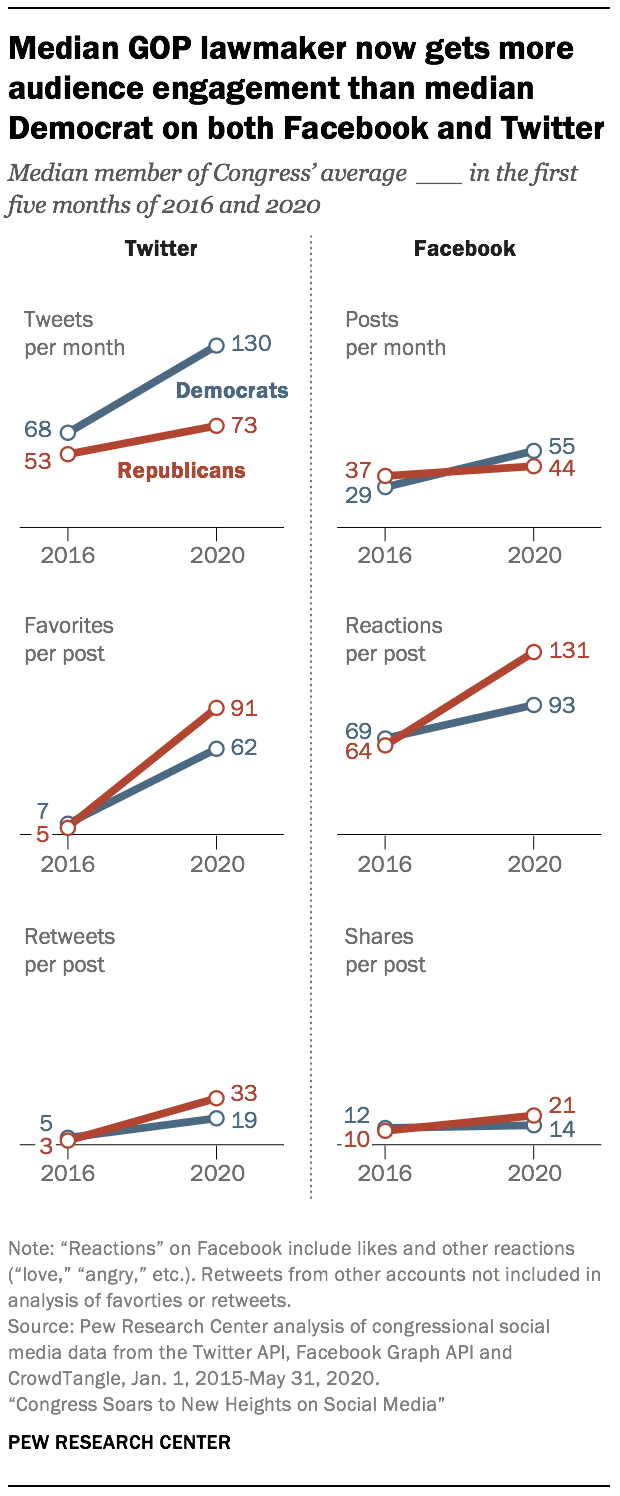
Today, Democratic members tend to post more often and have more followers on Twitter. Relative to the typical (median) Republican member of Congress, the typical Democratic member has over 17,000 more followers on Twitter and posts nearly twice as many tweets in a typical month (130 vs. 73), differences that have grown substantially in the last four years. On Facebook, the typical member of each party has a similar number of followers and much smaller differences in posting volume.
These differences may to some degree reflect differences in the demographic compositions of the two platforms. A 2019 survey by the Center found that 62% of U.S. adults who use Twitter identify as Democrats or political independents who lean toward the Democratic Party, compared with 50% of U.S. adults who use Facebook.
But although the median Democratic lawmaker is more active on both platforms, through the first five months of 2020 the typical Republican received greater levels of audience engagement (as measured by reactions, shares, favorites and retweets) on both Facebook and Twitter.
Why this report focuses on the median member of Congress
In most cases this report characterizes social media activity by members of Congress in terms of averages and totals based on the median representative. When examining a particular party or timeframe, researchers first compute the relevant statistic for each member – such as their total number of posts or their average reactions and shares per post – and then select the representative in the middle (the 50th percentile).
When viewed as a simple total or average, many social media metrics (such as posting volume or audience engagement statistics) can be skewed by a small number of particularly prolific or popular users in a way that obscures the day-to-day reality of the majority. Therefore, the median serves as a useful baseline for measuring the behavior of the “typical” member of Congress and tracking widespread trends across Congress as a whole. As such, the words “median” and “typical” lawmaker are used interchangeably throughout the report.
But the report focuses at times on the behaviors of all lawmakers from a particular party or a subset of highly active members in order to highlight the extremes of congressional social media use.
Among the key themes from this analysis:
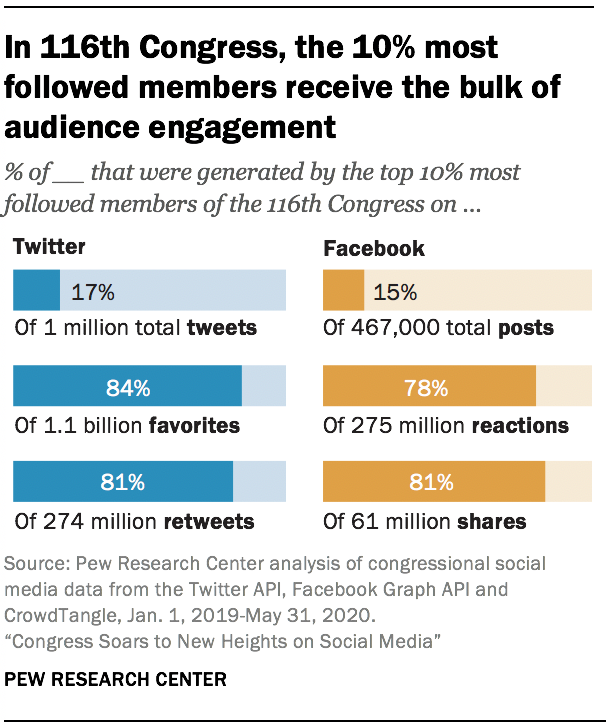
A small group of lawmakers with extremely large followings dominate the congressional social media narrative. As is true of both ordinary Twitter users and legislators in other countries, the majority of audience engagement goes to a small group of lawmakers with extremely large followings. In the 116th Congress, the 10% of members with the most followers on Facebook and Twitter have received more than three-quarters of all favorites, reactions, shares and retweets on these platforms. For example, tweets from members of Congress received about 1.1 billion favorites since January 2019 – and 907 million of those favorites went to just 10% of members.
Congress as a whole produces a vast amount of social media content each month. As a collective, the 116th Congress maintains over 2,000 active official, campaign and personal accounts on Facebook and Twitter (not counting institutional accounts that periodically change hands, such as committee chair or leadership accounts) with over a quarter-billion total followers between them.2 In an average month in 2020 so far, these accounts produce more than 100,000 tweets and Facebook posts, which receive tens of millions of audience favorites, reactions, shares and retweets.
Mentions of political opponents and hot-button issues are tied to spikes in audience reaction for Democrats and Republicans alike. Posts mentioning certain key terms or individuals are associated with above-average audience engagement in the form of favorites, reactions, shares and retweets. For instance, posts mentioning prominent figures associated with the other party (such as Democratic House Intelligence Committee Chairman Adam Schiff in the case of Republicans or Secretary of Education Betsy DeVos for Democrats) received a substantial boost in audience engagement relative to other posts.
By and large, the terms with high levels of audience engagement among Democrats and Republicans are unique to members of that party. But certain issues and individuals receive an outsize response from audiences across the political spectrum. In particular, mentions of Supreme Court Justice Brett Kavanaugh during his confirmation hearings were associated with consistently higher engagement for members of both parties.
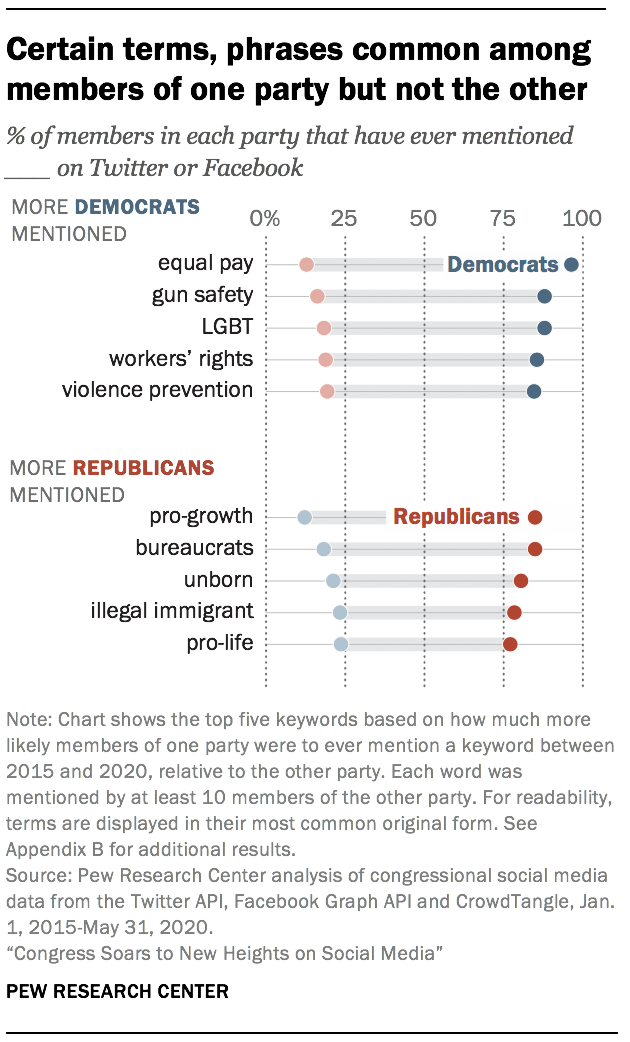
Certain words and phrases are used almost exclusively by members of one party. This collection of social media posts can also provide insights into the particular issues that are unique to each party. For instance, 96% of all Democrats – but just 13% of Republicans – have used the phrase “equal pay” on social media in the last five years. That phrase is one of the most distinctively Democratic phrases among members of Congress on social media. Meanwhile, the two most distinctive terms used by congressional Republicans over the last five years are “pro-growth” (used by 85% of Republicans and 12% of Democrats) and “bureaucrats” (used by 85% of Republicans and 18% of Democrats).3
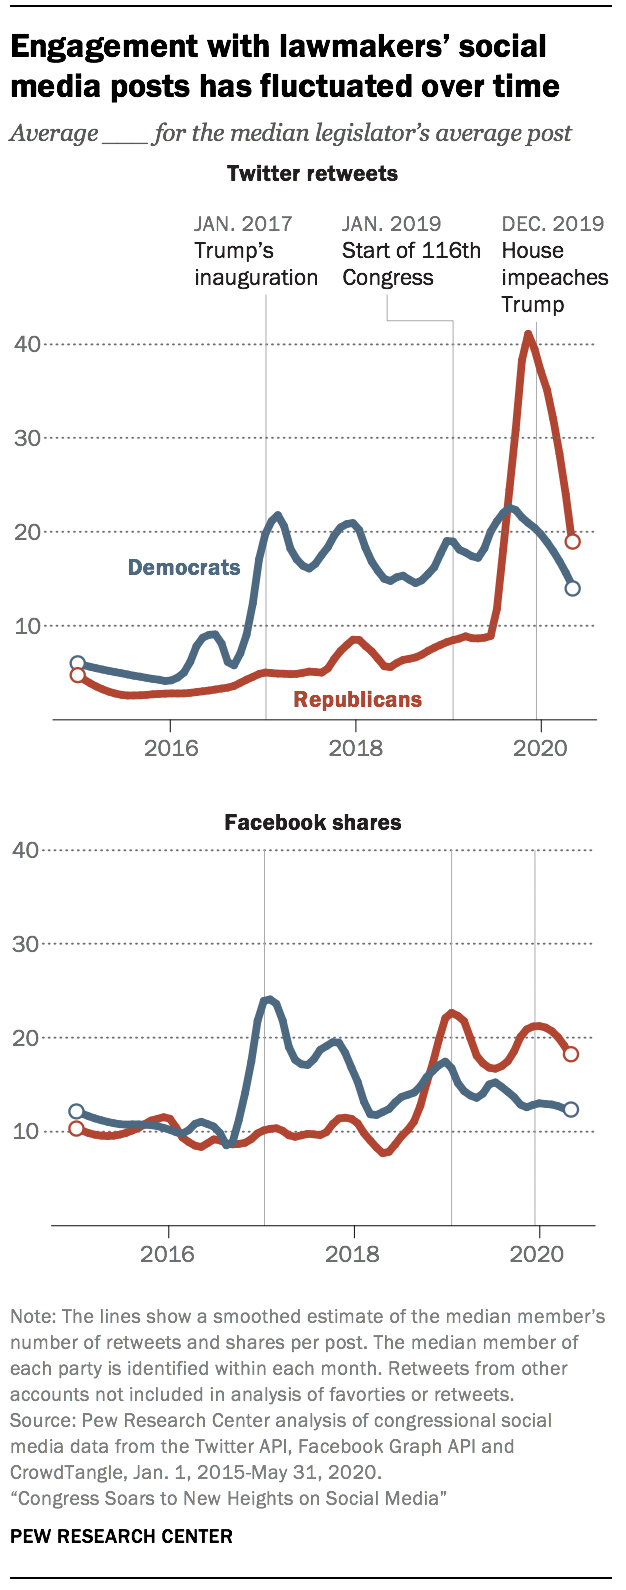
There have been striking ebbs and flows in the ways congressional social media use has unfolded over time. The shifts in audience engagement over time documented in this analysis illustrate the ways that events and news cycles influence interactions with congressional social media posts. At the level of the typical lawmaker, engagement with posts from Democrats was at its peak during the early months of the Trump administration and during heightened political moments such as the June 22, 2016, congressional sit-in to demand progress on gun control legislation. Meanwhile, recent boosts in Republican lawmaker engagement have coincided with events such as President Donald Trump’s impeachment trial.
At the median, posts from Democratic lawmakers tended to receive higher levels of audience engagement relative to those from Republicans during the inauguration and early months of the Trump administration. The typical Republican member began receiving higher average engagement than the typical Democrat on their Facebook posts in October 2018 and reached the same benchmark on Twitter in October 2019.
Viewed collectively, the majority of all engagement with congressional social media posts goes to Democrats. Republican lawmakers tend to receive more engagement on their posts than Democrats when viewed at the level of the median lawmaker. But when viewed as a whole – that is, by examining all the shares, retweets, favorites and reactions to congressional social media posts – Democrats receive the bulk of that engagement. In the first five months of 2020, the median Republican’s average post received more audience engagement on both platforms. But 73% of all favorites and 66% of retweets of lawmaker tweets went to Democrats, as did 74% of all reactions and 66% of shares of lawmaker posts on Facebook.
These findings speak to the ways in which Democratic and Republican lawmakers have wittingly or unwittingly carved out different collective approaches to social media communications. Because Democrats post more content on these platforms and have a larger number of high-follower accounts,4 the bulk of all audience engagement with lawmakers on social media goes to Democrats as a collective. Republican lawmakers tend to be less active posters and have fewer of these highly successful accounts, but their posts tend to receive more audience engagement at the level of individual members.
