

Twitter is a modern public square where many voices discuss, debate and share their views. Media personalities, politicians and the public turn to social networks for real-time information and reactions to the day’s events. But compared with the U.S. public overall, which voices are represented on Twitter?
To examine this question, Pew Research Center conducted a nationally representative survey of 2,791 U.S. adult Twitter users who were willing to share their Twitter handles.1 The design of this survey provides a unique opportunity to measure the characteristics and attitudes of Twitter users in the United States and link those observations to actual Twitter behaviors, such as how often users tweet or how many accounts they follow.
The analysis indicates that the 22% of American adults who use Twitter are representative of the broader population in certain ways, but not others. Twitter users are younger, more likely to identify as Democrats, more highly educated and have higher incomes than U.S. adults overall. Twitter users also differ from the broader population on some key social issues. For instance, Twitter users are somewhat more likely to say that immigrants strengthen rather than weaken the country and to see evidence of racial and gender-based inequalities in society. But on other subjects, the views of Twitter users are not dramatically different from those expressed by all U.S. adults.
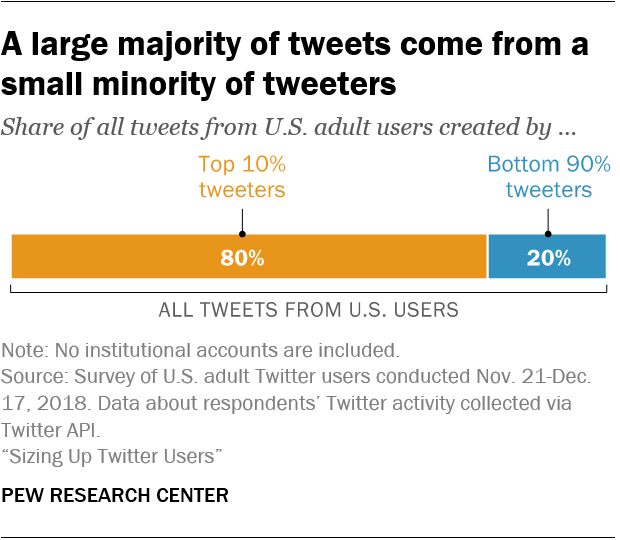
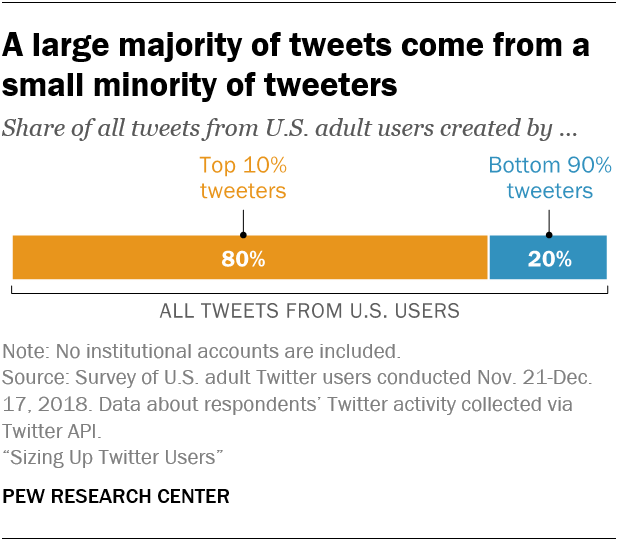
In addition to teasing out these differences between Twitter users and the population as a whole, this analysis also highlights the sizable diversity among Twitter users themselves. The median user tweets just twice each month, but a small cohort of extremely active Twitter users posts with much greater regularity. As a result, much of the content posted by Americans on Twitter reflects a small number of authors. The 10% of users who are most active in terms of tweeting are responsible for 80% of all tweets created by U.S. users.
Individuals who are among the top 10% most active tweeters also differ from those who tweet rarely in ways that go beyond the volume of content they produce. Compared with other U.S. adults on Twitter, they are much more likely to be women and more likely to say they regularly tweet about politics. That said, there are only modest differences in many attitudes between those who tweet frequently and those who do not.
How Pew Research Center linked survey data with social media accounts
Researchers recruited respondents from Ipsos’ KnowledgePanel, a probability-based online panel of U.S. adults. The sample included panelists identified by Ipsos as likely Twitter users. Respondents were screened for eligibility, and those who confirmed that they used Twitter were asked to share their Twitter handle in order to participate in the study. Out of 4,829 individuals who were screened, 3,649 (76%) confirmed that they used Twitter. Of these confirmed users, 3,293 (90%) agreed to provide their Twitter handle and completed the survey. Next, researchers reviewed each account and removed any that were nonexistent or belonged to institutions, products or international entities. This report is based on the remaining 2,791 respondents who both completed the survey and provided a valid handle (76% of confirmed Twitter users). Twitter users can choose not to post tweets publicly, but the Twitter API makes summary statistics about all accounts – public or private – available. The sample was weighted to be equivalent to a national sample of Twitter users identified on the November 2018 wave of the Center’s American Trends Panel. More information about the surveys used in this report appears in the Methodology section.
Twitter users are younger, more educated and more likely to be Democrats than general public
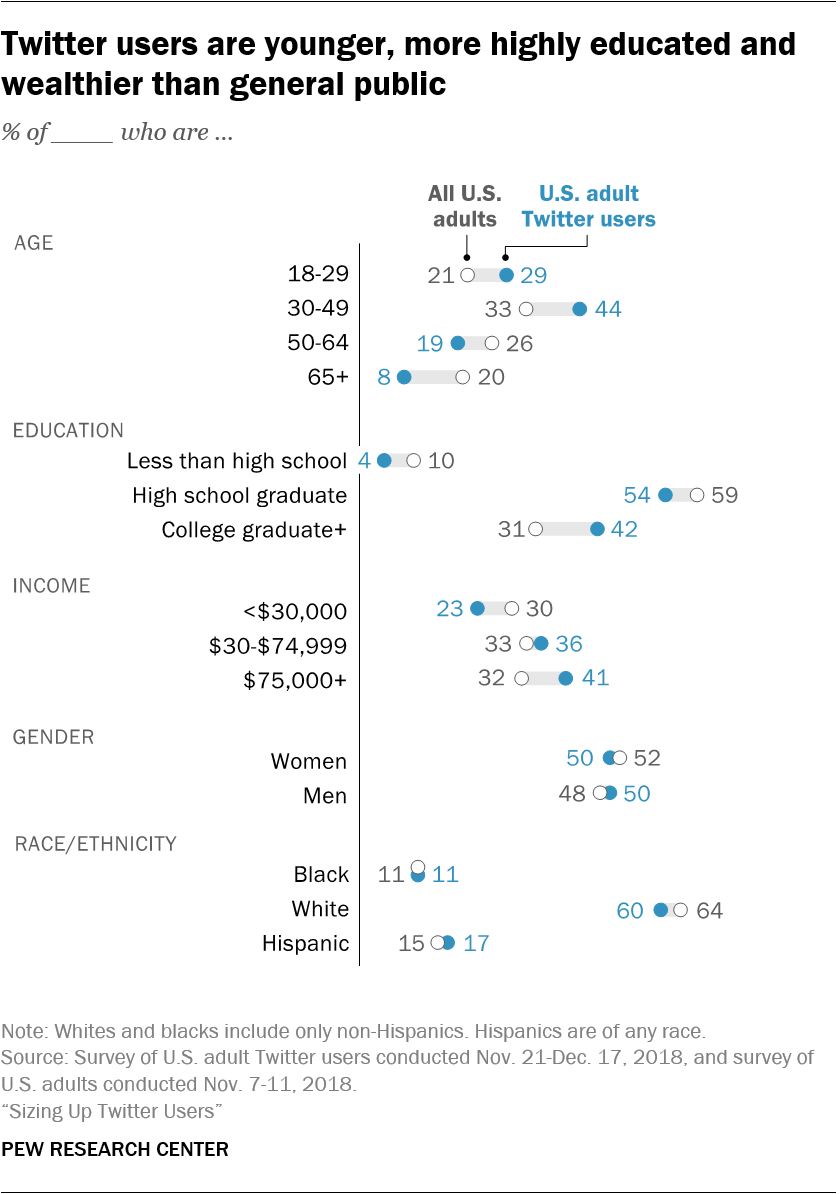
U.S. adult Twitter users differ in significant ways from the overall U.S. adult population. Most notably, Twitter users are much younger than the average U.S adult and are also more likely than the general public to have a college degree. The median age of adult U.S. Twitter users is 40, while the median U.S. adult is 47 years old. Put differently, the U.S. adult population is nearly equally divided between those ages 18 to 49 and those ages 50 and older. But Twitter users are nearly three times as likely to be younger than 50 (73%) as to be 50 or older (27%).
Although less pronounced than these differences in age, Twitter users also tend to have higher levels of household income and educational attainment relative to the general adult population. Some 42% of adult Twitter users have at least a bachelor’s degree – 11 percentage points higher than the overall share of the public with this level of education (31%). Similarly, the number of adult Twitter users reporting a household income above $75,000 is 9 points greater than the same figure in the general population: 41% vs. 32%. But the gender and racial or ethnic makeup of Twitter users is largely similar to the adult population as a whole.
Twitter users more likely to be Democrats
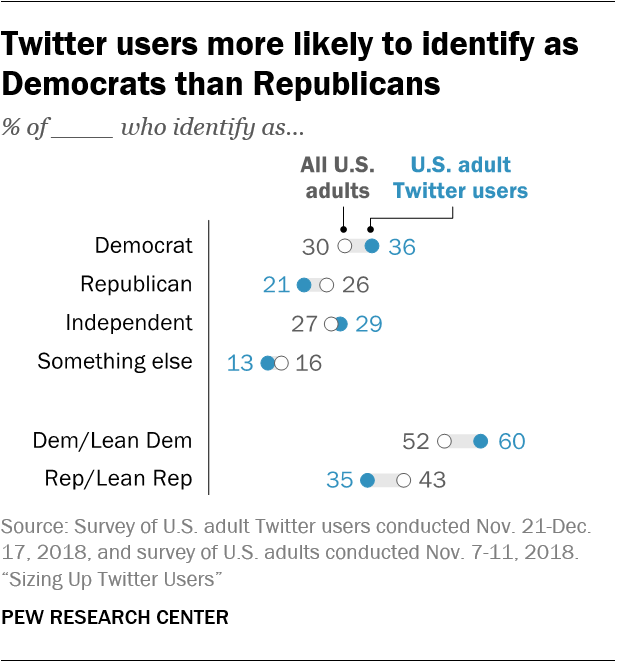
Twitter users are more likely to identify with the Democratic Party compared with U.S. adults more generally: 36% do so, compared with 30% of U.S. adults, according to a national survey of all adults conducted in November 2018. Similarly, 26% of U.S. adults identify as Republican, versus 21% of adult Twitter users. Political independents make up a similar share of the general public (27%) and Twitter users (29%).
Of course, many political independents actually lean toward one of the two major parties. Of the Americans who lean toward either party, 52% of U.S. adults identify as Democrats or lean toward the Democratic Party, while 60% of U.S. adult Twitter users say the same. Similarly, 43% of U.S. adults identify as or lean Republican, compared with 35% of adult Twitter users.
These partisan differences between Twitter users and the general public persist when looking across certain age groups. Specifically, nearly two-thirds (63%) of Twitter users ages 18 to 49 identify as Democrats or lean toward the Democratic Party, compared with the 55% of 18- to 49-year-olds who identify the same way. Among older users, these differences are similar. Some 53% of Twitter users age 50 or older identify as Democrats or lean Democratic, a figure that is somewhat higher than the 47% of U.S. adults in this age group who identify with or lean toward the Democratic Party.
In terms of political ideology, Twitter users are less likely than U.S. adults more broadly to characterize their views as very conservative. On an 11-point scale ranging from 0 (“very conservative”) to 10 (“very liberal”), 14% of Twitter users place themselves between 0 and 2, compared with 25% of the general public. At the same time, similar shares of Twitter users and U.S. adults identify as very liberal. And although Twitter users are somewhat more likely to report having voted in the 2018 midterm elections, these differences are relatively modest: 60% of Twitter users reported that they definitely voted in 2018, compared with 55% of all U.S. adults.
Twitter users have somewhat different attitudes than the general population
Twitter users as a group express distinct opinions relative to the public as a whole on some political values, particularly when it comes to views having to do with race, immigration and gender. A larger share of Twitter users – who as noted above are more likely to identify as Democrats relative to the population as a whole – say that blacks are treated less fairly than whites (64% of Twitter users vs. 54% of Americans). They are also more likely than the U.S. general public to say that immigrants strengthen the U.S. (66% vs. 57%) and that barriers exist in society that make it harder for women to get ahead (62% vs. 56%).
In other ways, the views of Twitter users differ only slightly from those of all U.S. adults. Twitter users are somewhat more likely to say that people take offensive content they see online too seriously (59% say this, compared with 54% of U.S. adults), and are somewhat less likely to report being “very attached” to their local community (12% vs. 17%).2
Those most active on Twitter differ from the rest of adult U.S. users
In addition to these differences between Twitter users and the rest of the population, there are also significant differences between the most active Twitter users (as measured by the quantity of tweets they post) and those who post less frequently.
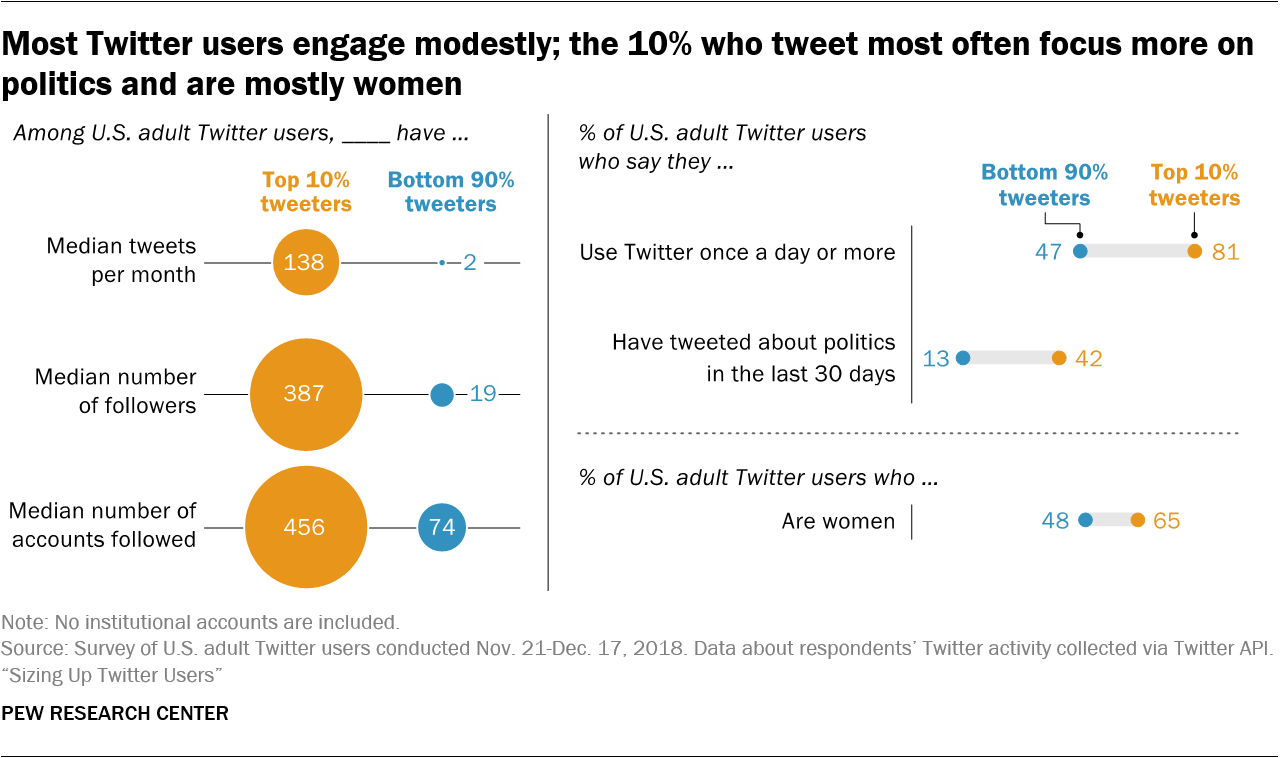
By definition, the most active tweeters produce a large amount of content relative to the rest of the Twitter population. But the scope of these differences is profound. The median Twitter user posts just two times a month, but the most prolific 10% of Twitter users in terms of tweet volume produce a median of 138 tweets monthly. In fact, this analysis estimates that the top 10% of tweeters are responsible for 80% of the tweets created by all U.S. adults on Twitter.
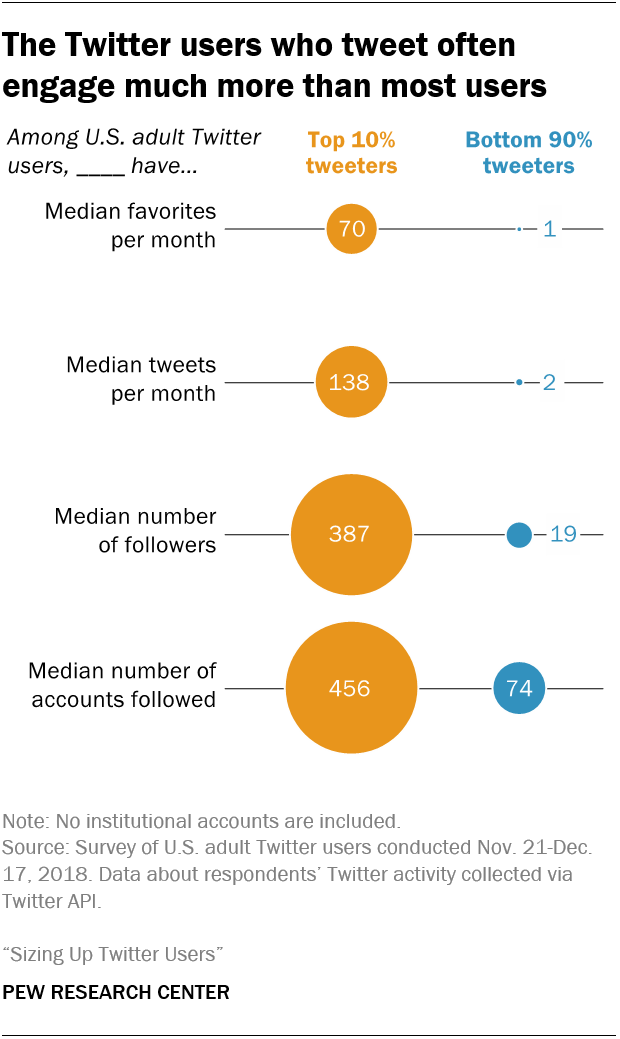
The behaviors of these highly active tweeters also differ from the rest of the Twitter population in ways that go beyond tweet volume. The median user in the top 10% by tweet volume creates 138 tweets per month, “favorites” 70 posts per month, follows 456 accounts, and has 387 followers.3 By comparison, the median user in the bottom 90% of tweeters creates just two tweets per month, “favorites” one post per month, follows 74 accounts, and has 19 followers. And when asked to report how often they use the platform, fully 81% of these highly active tweeters say they do so every day; 47% of other Twitter users visit the platform with this regularity.
Members of the top 10% of tweeters also have distinct attitudes, behaviors and personal characteristics compared with those who use the platform less often. These prolific tweeters are more likely to be women: 65% are, compared with 48% of the bottom 90% of tweeters. And these most active tweeters are much more likely than others to say they post about political issues. Fully 69% of the top 10% most prolific tweeters say they have tweeted about politics, compared with 39% of Twitter users generally. And 42% say they have tweeted about politics in the last 30 days, compared with just 13% of other users.
The Twitter platform provides multiple ways to post and share content, but the top 10% of tweeters are more likely to report using automated methods that allow others to post tweets on their behalf: 25% of highly prolific tweeters have done so, compared with only 15% of Twitter users in the bottom 90%.
Despite the differences between highly active tweeters and those who are less active, other instances show these active users differ only modestly – or not at all – from the rest of the Twitter population. Although prolific tweeters report tweeting about politics with great regularity, their overall partisanship is not out of sync with other Twitter users. Overall, 61% identify as Democrats or lean toward the Democratic Party, compared to 60% among other users.
And there are only modest differences between the top 10% of tweeters and the bottom 90% in other views. Identical shares of both groups (64%) say blacks are treated less fairly than whites. But the top 10% of tweeters are somewhat more likely than the bottom 90% to say that immigrant newcomers to this country strengthen American society (70% vs. 65%), or to say there are still significant obstacles in society that make it harder for women than men to get ahead (69% vs. 62%).


