The analysis of Twitter users in this report is based on a nationally representative survey conducted from Nov. 21 to Dec. 17, 2018, among a sample of 2,791 U.S. adults ages 18 years and older who have a Twitter account and agreed to allow researchers to access that account. The margin of error for the full sample is plus or minus 3.0 percentage points.
The survey was conducted by Ipsos in English using KnowledgePanel, its nationally representative online research panel. KnowledgePanel members are recruited through probability sampling methods and include those with internet access and those who did not have internet access at the time of their recruitment (KnowledgePanel provides internet access for those who do not have it, and if needed, a device to access the internet when they join the panel). A combination of random-digit dialing (RDD) and address-based sampling (ABS) methodologies have been used to recruit panel members (in 2009 KnowledgePanel switched its sampling methodology for recruiting members from RDD to ABS). KnowledgePanel continually recruits new panel members throughout the year to offset panel attrition.
All active members of the Ipsos panel with an active Twitter account were eligible for inclusion in this study. In all, 4,829 panelists responded to the survey. Of that group, 3,649 (76%) confirmed that they used Twitter. Among confirmed Twitter users, 3,293 (90%) agreed to provide their Twitter handle and complete the survey. Next, researchers reviewed each account and removed any that were nonexistent or belonged to institutions, products or international entities. This report is based on the remaining 2,791 respondents who both completed the survey and provided a valid handle (76% of confirmed Twitter users).
The final sample of 2,791 adults was weighted using an iterative technique that matches gender, age, race, Hispanic origin, education, region, party identification, volunteerism, voter registration, and metropolitan area to the parameters of the American Trends Panel November 2018 survey of Twitter users. This weight is multiplied by an initial sampling, or base weight, that corrects for differences in the probability of selection of various segments of Ipsos’s sample as well as by a panel weight that adjusts for any biases due to nonresponse and noncoverage at the panel recruitment stage using all of the attributes described above.
Sampling errors and statistical tests of significance take into account the effect of weighting at each of these stages. In addition to sampling error, question wording and practical difficulties in conducting surveys can introduce error or bias into the findings of opinion polls.
The American Trends Panel survey methodology
The American Trends Panel (ATP), created by Pew Research Center, is a nationally representative panel of randomly selected U.S. adults. Panelists participate via self-administered web surveys. Panelists who do not have internet access at home are provided with a tablet and wireless internet connection. The panel is managed by Ipsos.
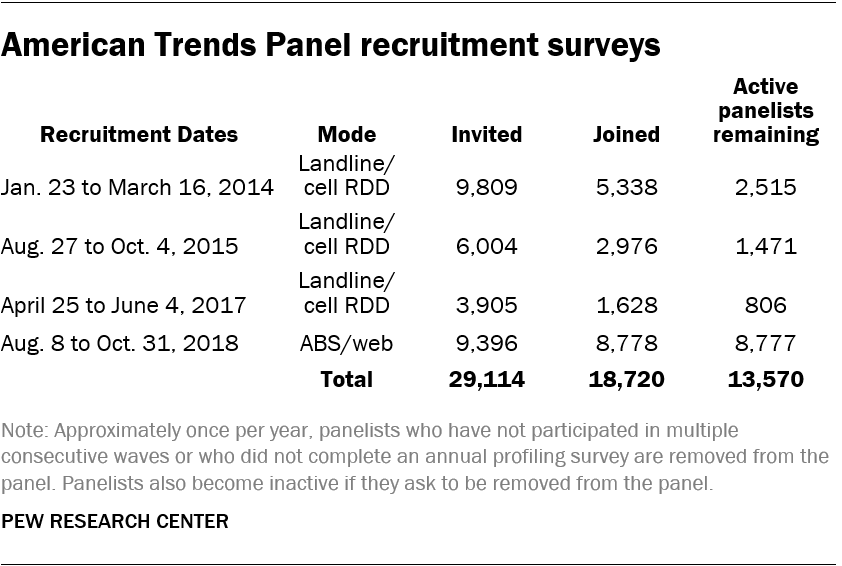
The ATP was created in 2014, with the first cohort of panelists invited to join the panel at the end of a large national landline and cellphone random-digit-dial survey that was conducted in both English and Spanish. Two additional recruitments were conducted using the same method in 2015 and 2017, respectively. Across these three surveys, a total of 19,718 adults were invited to join the ATP, of whom 9,942 agreed to participate.
In August 2018, the ATP switched from telephone to address-based recruitment. Invitations were sent to a random, address-based sample (ABS) of households selected from the U.S. Postal Service’s Delivery Sequence File. In each household, the adult with the next birthday was asked to go online to complete a survey, at the end of which they were invited to join the panel. For a random half sample of invitations, households without internet access were instructed to return a postcard. These households were contacted by telephone and sent a tablet if they agreed to participate. A total of 9,396 were invited to join the panel, and 8,778 agreed to join the panel and completed an initial profile survey.
Of the 18,720 individuals who have ever joined the ATP, 13,569 remain active panelists and continue to receive survey invitations.
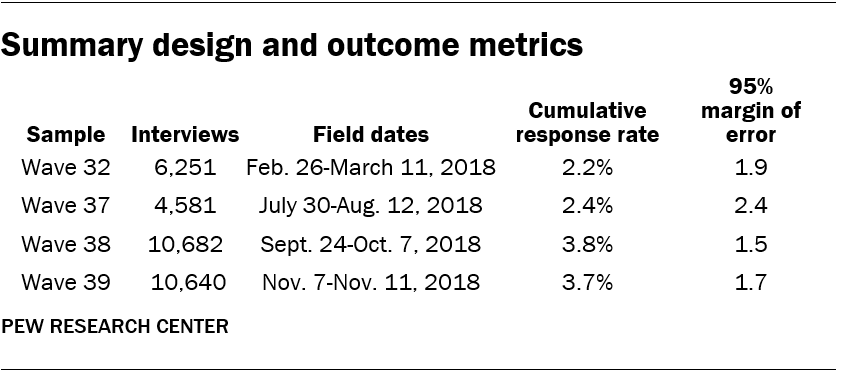
The questions from the ATP that were used in this report were asked on four different waves of the panel, which are fielded roughly once a month. All panel waves were fielded in 2018. Estimates for each question are calculated using the respondents and weights that correspond to the wave in which it was asked. Some items, such as demographics, were measured at recruitment and updated periodically, in which case they do not belong to any individual wave. For these kinds of questions, estimates are based on the respondents and weights from Wave 39.
The field dates and sample sizes for each ATP wave are presented in the table below. Cumulative response rates account for nonresponse to the recruitment surveys and panel attrition in addition to nonresponse to the individual panel waves.
Weighting
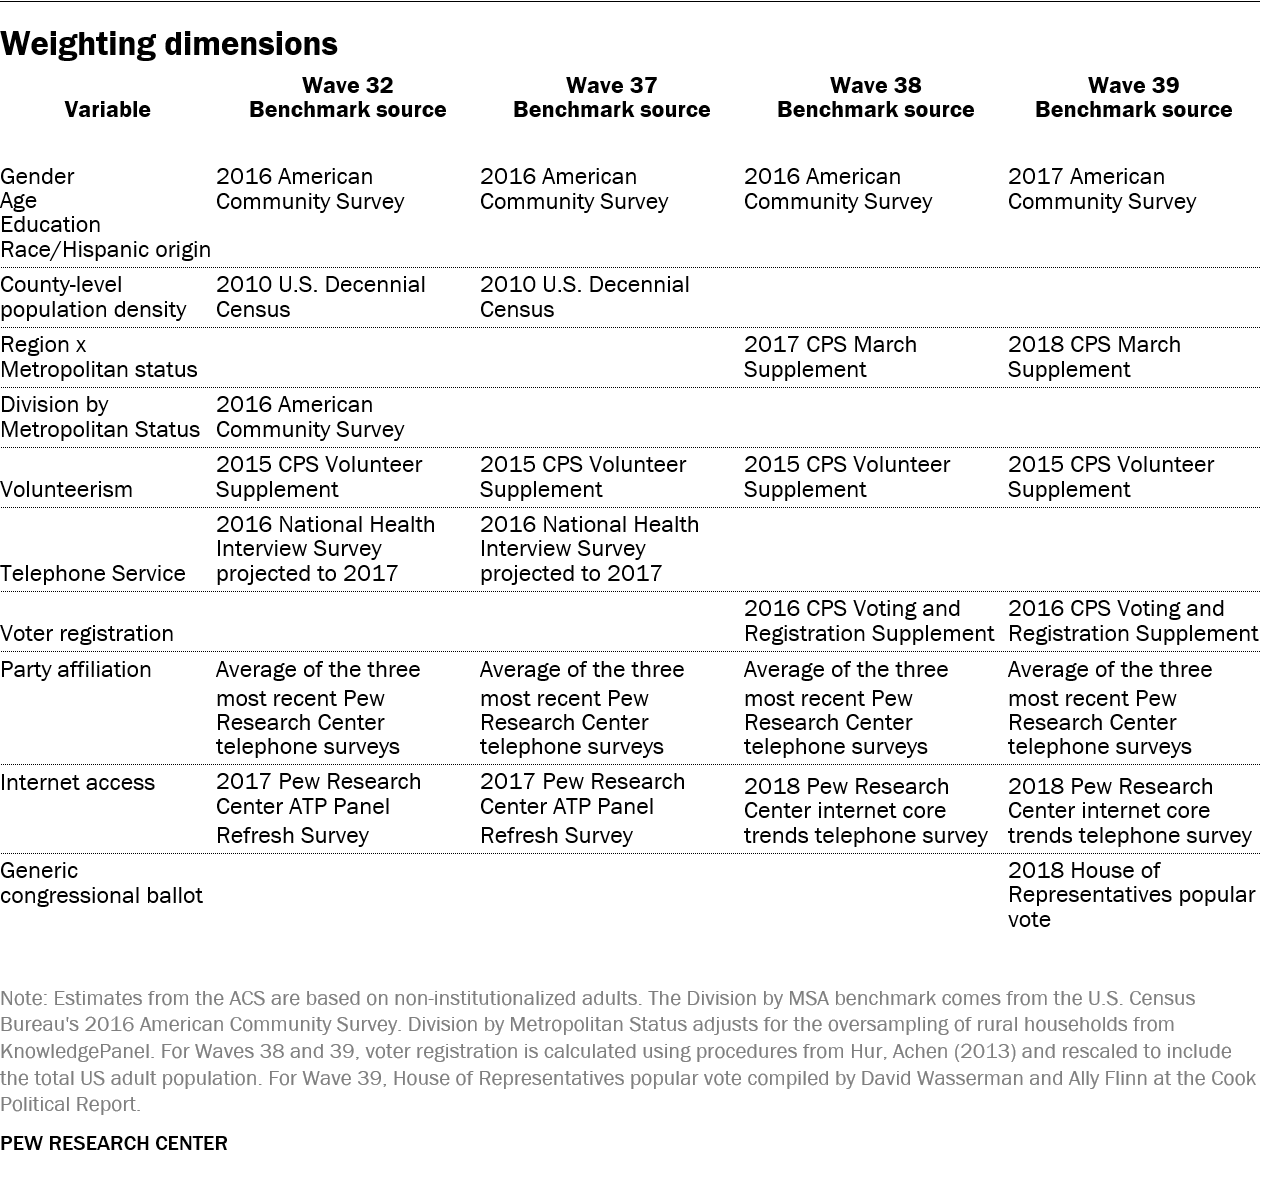
The ATP data were weighted in a multistep process that begins with a base weight incorporating the respondents’ original survey selection probability and the fact that in 2014 and 2017 some respondents were subsampled for invitation to the panel. The next step in the weighting uses an iterative technique that aligns the sample to population benchmarks on the dimensions listed in the accompanying tables.
Sampling errors and statistical significance tests take into account the effect of weighting. Interviews are conducted in both English and Spanish, but the American Trends Panel’s Hispanic sample is predominantly U.S. born and English speaking.
In addition to sampling error, one should bear in mind that question wording and practical difficulties in conducting surveys can introduce error or bias into the findings of opinion polls.
Defining the ‘engaged’ or ‘heavy’ Twitter user
Examining a small group of high-volume tweeters – the technique used in the body of this report – does not capture the broader set of activities that may define highly engaged users – such as following, liking and being followed by others. To better understand engaged users in general, and to ensure that the picture drawn by the behavior of heavy tweeters was broadly resonant with a more nuanced definition of engagement, researchers used a clustering model based on an array of behaviors to classify all respondents’ accounts into two groups: light users (who tweet less, follow less, like less and have fewer followers) and heavy users (who are more engaged on all these dimensions).
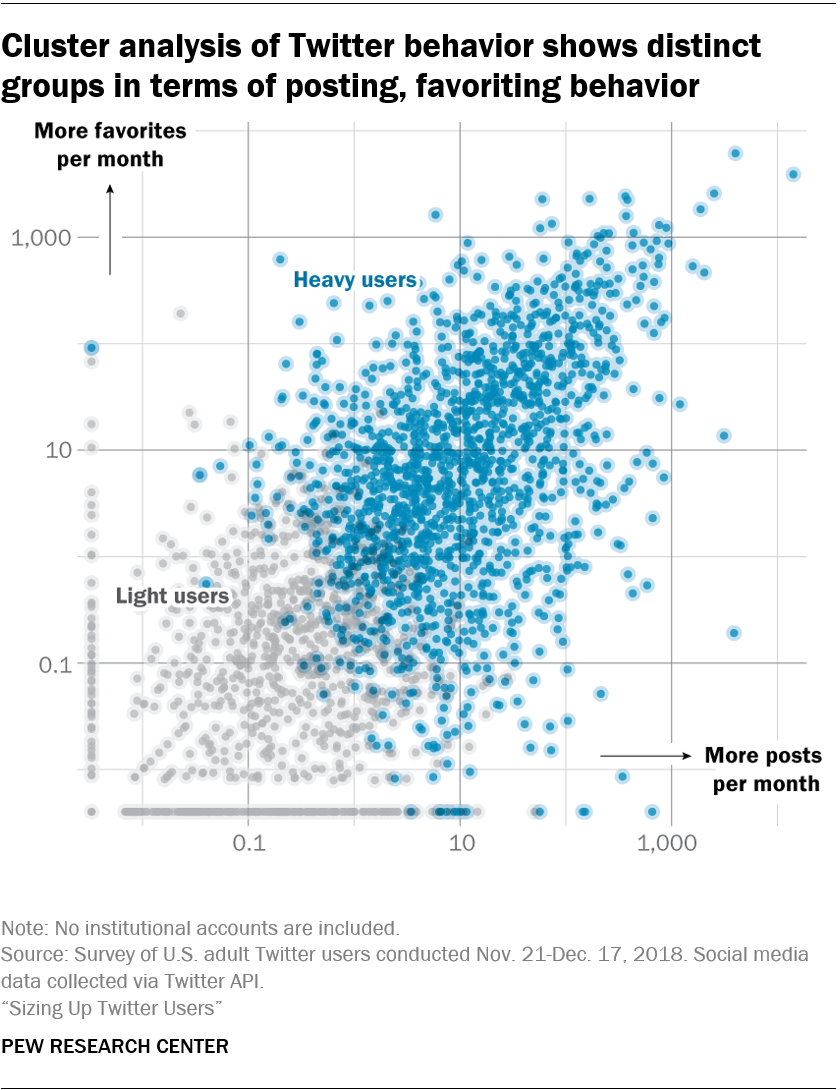
To create these two groups, researchers used a model that incorporates information about how often people tweet, how many accounts they follow, how many accounts follow them, how many tweets they “like” and how long they’ve been active on the platform. Researchers were not able to measure how frequently users logged into Twitter and passively viewed content, however. The Twitter API only provides access to posts, favorites, which accounts users follow, which accounts follow users, retweeting and quote-tweeting.
The research team used a technique called K-means clustering to identify highly active users using this broader set of measures. The method takes a set of variables and a predetermined set of clusters and classifies users into groups based on whether a given user’s behavior is most similar to the mean of one cluster or another.
The cluster model used as inputs:
- Number of posts per day
- Number of favorites per day
- Number of followers
- Number of accounts following
- Account age
Researchers took the log of each of the above variables and fit a K-means model to classify users into groups. Using this technique, they classified 60% of Twitter users as heavy users and 40% as light users. The heavy user cluster showed a higher correlation across all the input variables relative to the light users cluster. Researchers tested alternative clustering models and increased the cluster size to three, but this created an additional very small group of users without distinctive behavioral patterns.
Unsurprisingly, heavy users are more likely to report using Twitter frequently in daily life than those labeled as light users, but the top 10% of users by tweet volume still eclipse them by a substantial margin, with 61% of heavy users saying they use the site daily, compared with 33% of light users. And 81% of the top 10% of tweeters by volume say they use the platform daily.
Heavy users are more likely to use automated tools to post compared to light tweeters: 18% of heavy users say they have given permission for automated tools to post on their behalf, compared with 13% for light users. Among the top 10% of tweeters, 25% say they have given permission to post on their behalf.
Heavy users spend more of their time tweeting about politics. The study found that 22% report discussing politics on Twitter within the last 30 days, compared with just 6% of light users. For comparison, 42% of those in the top 10% of tweeters say they have tweeted about politics in the last 30 days. Indeed, 74% of those in the light user group say they never tweet about politics, compared with 46% for heavy users. Just 28% of users in the top 10% of tweeters say they never tweet about politics.
Heavy users are more likely to be Democrats and to identify as liberal than light users. 64% of heavy users identify as Democrats or lean toward the party, compared with 55% of light users. By comparison, 61% of the top 10% of tweeters by volume identify as Democrats or lean toward the Democratic Party.
Similar to top 10% tweeters, heavy users are also more likely to be women (52% compared with 46% for light users). The study also finds that 65% of users in the top 10% by tweet volume are women.


