
After the 2016 presidential election, Facebook users began using the “angry” button much more often when reacting to posts created by members of Congress.
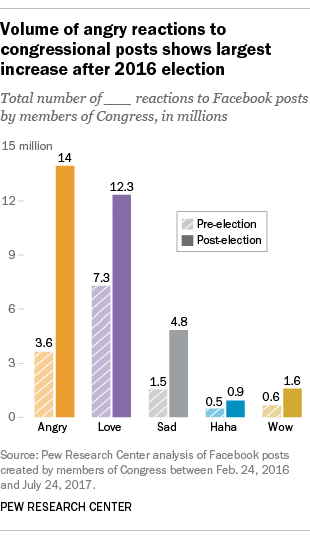
Between Feb. 24, 2016 – when Facebook first gave its users the option of clicking on the “angry” reaction, as well as the emotional reactions “love,” “sad,” “haha” and “wow” – and Election Day, the congressional Facebook audience used the “angry” button in response to lawmakers’ posts a total of 3.6 million times. But during the same amount of time following the election, that number increased more than threefold, to nearly 14 million. The trend toward using the “angry” reaction continued during the last three months of 2017.
Use of the “love” reaction also increased after Election Day, but at a slower rate. Users reacted to congressional posts with the “love” button 7 million times in the period before the election, a figure that rose to about 12 million in the period afterward. While “love” was the most popular new reaction before the election, “angry” became the most popular afterward.
To arrive at these figures, Pew Research Center analyzed all Facebook posts created by members of Congress on or after Feb. 24, 2016, and extending through July 24, 2017 – a total of 360,173 individual posts.
While the use of all five new emotional reactions increased across the study period, the use of the “angry” reaction outpaced the other four new emoji options. “Angry” increased by 385%, compared with 169% for “love.” The use of “sad” increased by 315%, moving from 1.5 million to 4.8 million total reactions. The “wow” and “haha” reactions were less popular overall, but still increased by 244% and 191%, respectively.
While anger became the most popular new reaction after the 2016 election, “likes” have always been the most popular way for people to engage with congressional Facebook posts. Between Feb. 24 and Nov. 8, 2016, congressional posts received 111 million “likes,” a number that increased by 17% percent, to 129 million, between the day after the 2016 election and July 24, 2017.
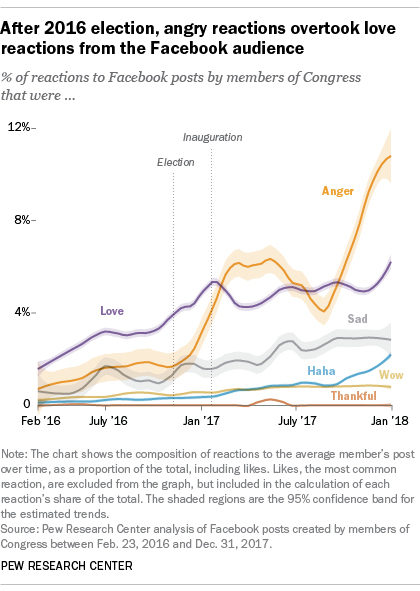
The increased popularity of anger after the election is also apparent when examining the share of emotional reactions and “likes” that individual posts received. By that measure, anger emerged as the most popular reaction – other than “likes” – soon after President Donald Trump’s January 2017 inauguration, beating out the “love” reaction for the first time. By the end of 2017, the difference became much more pronounced.
Just 2% of all Facebook reactions to congressional posts were “angry” in the period leading up to the 2016 election. But after the election and through the end of 2017, that share tripled, to 6%. By December 2017, 11% of lawmakers’ posts received “angry” responses, including 9% of posts by Democrats and 13% of posts by Republicans. (This part of the Center’s analysis includes the full set of congressional posts created between Feb. 24, 2016, and the end of 2017 – 465,864 posts. It also includes the “thankful” reaction, which Facebook introduced for Mother’s Day in 2017.)
When it comes to the content of congressional Facebook posts, those that were more confrontational were more likely to inspire “angry” reactions. Confrontational posts are defined as those that expressed opposition toward a number of politicians and political groups, including Trump, Barack Obama, Hillary Clinton, Democrats and Republicans. Overall, 69,318 posts – 15% of all posts created between Feb. 24, 2016, and Dec. 31, 2017 – expressed opposition.
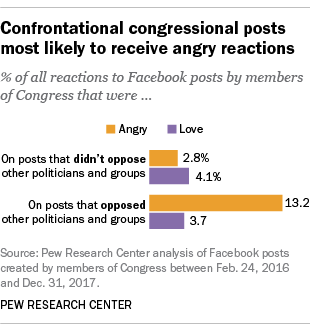
Among posts that expressed this kind of confrontational rhetoric, 13% of the reactions to the average post received “angry” feedback. By comparison, just 3% of reactions for posts that did not express political opposition were angry. However, when it comes to the “love” reaction, there was no meaningful difference in the rates at which the congressional Facebook audience responded to confrontational posts (about 4% both for posts expressing opposition and for those not expressing opposition).
Note: See methodology here (PDF).

