Involvement with political issues can take many forms — such as joining or volunteering for a politically motivated group, petitioning the government about policy issues, donating money to an organization or cause, or simply talking about important issues around the dinner table or office water cooler. In this survey we asked about a number of different political activities — including direct involvement with political activities or groups; speaking out publicly or petitioning government officials through online and offline channels; and political behaviors on social networking sites such as Facebook or Twitter — and found that 72% of American adults have taken part in at least one of those actions or behaviors.5 In this chapter of the report, we examine some of these specific behaviors and activities, with a particular focus on people who are especially active in political or social issues.
Half of all U.S. adults have gotten personally involved in a civic group or event in the preceding year.
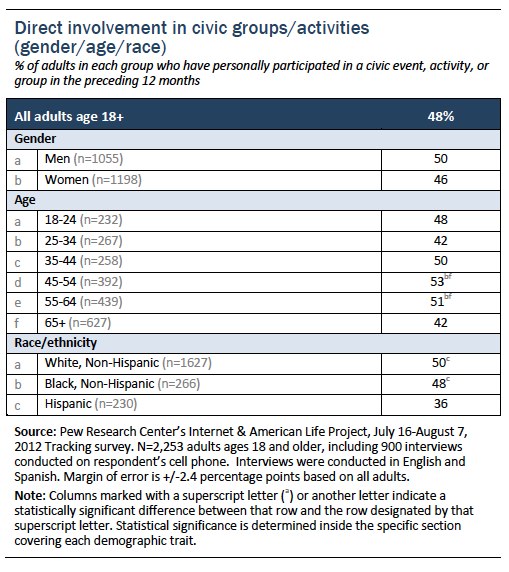
Half of the adult U.S. population (48%) has been directly involved in a civic group, or has taken part in some kind of “in person” activity around a political or social issue in the 12 months preceding our August 2012 survey. We came to this figure by asking about six different political activities that people might take part in (see the table below for a full list) and found that 48% of Americans have done at least one of them (with that group being evenly split between those who did a single activity out of the six we measured and those who took part in multiple activities).
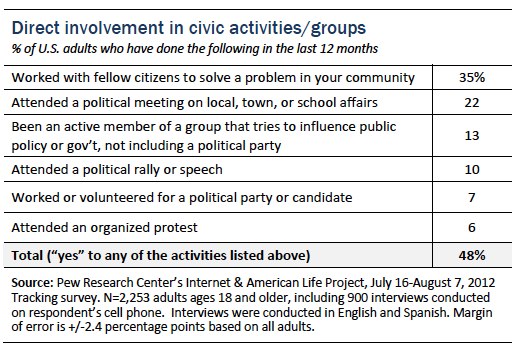
We asked a similar set of questions in August 2008, and overall there has been little change in these behaviors over the four years between 2008 and 2012. The proportion of adults who have recently worked with fellow citizens to solve a problem in their community increased from 28% in August 2008 to 35% at a similar point in 2012, but otherwise these behaviors were equally prevalent in 2008 and 2012.
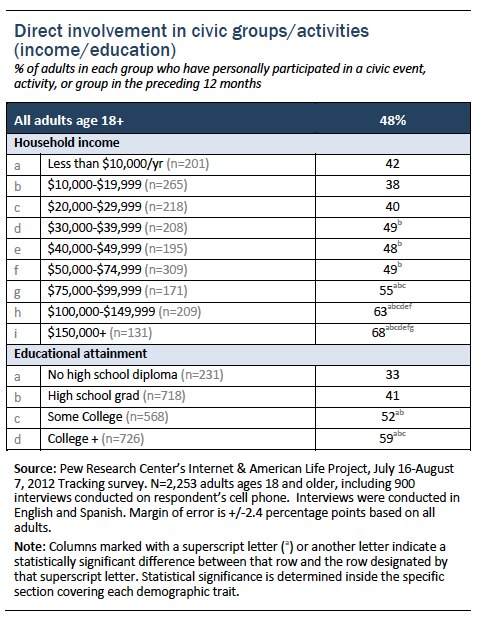
In addition, a key finding of our 2008 research was that Americans with high levels of income and educational attainment are much more likely than the less educated and less well-off to take part in groups or events organized around advancing political or social issues. That tendency is as true today as it was four years ago, as this type of political involvement remains heavily associated with both household income and educational attainment.
In terms of political affiliation and ideology, liberal Democrats take part in political groups or activities at relatively high rates compared to other Democrats and to moderate or conservative Republicans (these liberal Democrats are especially likely to attend a political meeting on local, town, or school affairs; to be an active member of a political group; and to attend an organized protest).
Additionally, Democrats in general are more likely than Republicans to have recently attended an organized protest, and liberals in general are more likely to do this than conservatives and moderates. Otherwise, there are relatively few differences on this subject related to party identification or political ideology.

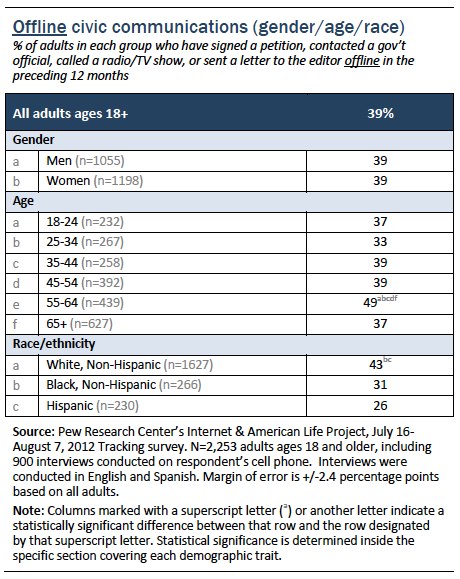
39% of all U.S. adults have used offline methods to contact a government official or speak out in a media channel about an issue that is important to them, and one third have done so using online methods.
In addition to asking about their direct involvement in civic events or activities, we also asked our survey respondents whether they have spoken out recently about political or social issues in various spaces or public forums. As we did in our 2008 study on this subject, we asked about four separate types of civic communication, each having an online and an offline component:
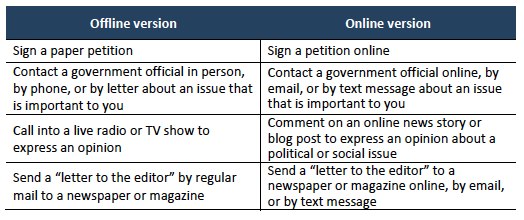
In total, 39% of U.S. adults have recently taken part in at least one of the four offline activities that we asked about:
- 22% of U.S. adults have signed a paper petition
- 21% of U.S. adults have contacted a national, state, or local government official in person, by phone, or by letter about an issue that is important to them
- 7% have called into a live radio or TV show to express an opinion
- 3% have sent a “letter to the editor” to a newspaper or magazine by regular mail
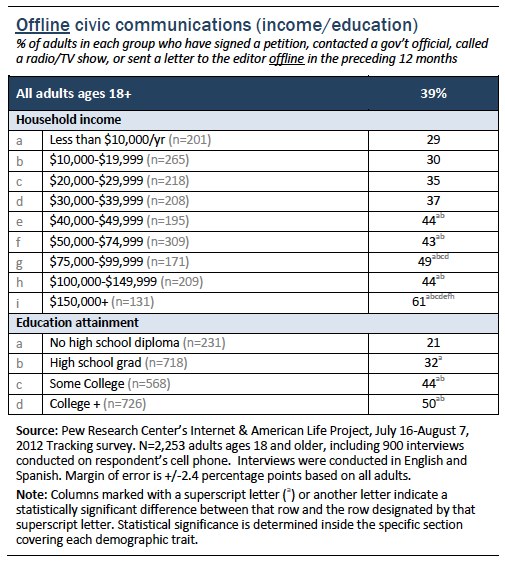
As with the “personal/group engagement” activities discussed above, the well-educated and financially well-off are especially likely to speak out about political or social issues in this way, and whites are more likely to do so than non-whites.
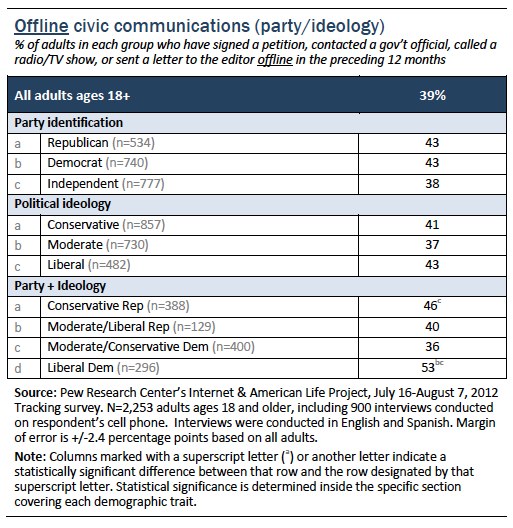
When it comes to partisanship and political ideology, conservative Republicans and liberal Democrats are more likely than moderate/liberal Republicans or moderate/conservative Democrats to have done at least one of the four offline activities we asked about in our survey. In terms of specific activities, political liberals and liberal Democrats are especially likely to have recently signed a paper petition, while conservative Republicans and liberal Democrats are especially likely to have recently contacted a government official using offline means.
Looking at the online versions of our “civic communications” behaviors:
- 21% of internet users have commented on an online news story or blog post to express an opinion about a political or social issue
- 20% of internet users have signed a petition online
- 20% of internet or text message users have contacted a national, state, or local government official online, by email, or by text message about an issue that is important to them.
- 5% of internet or text message users have sent a “letter to the editor” to a newspaper or magazine online, by email, or by text message
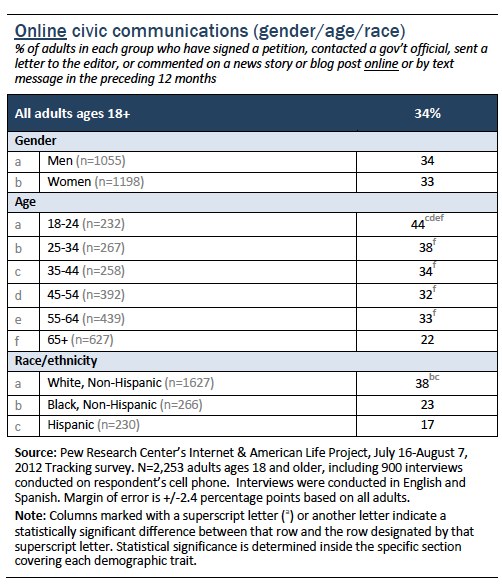
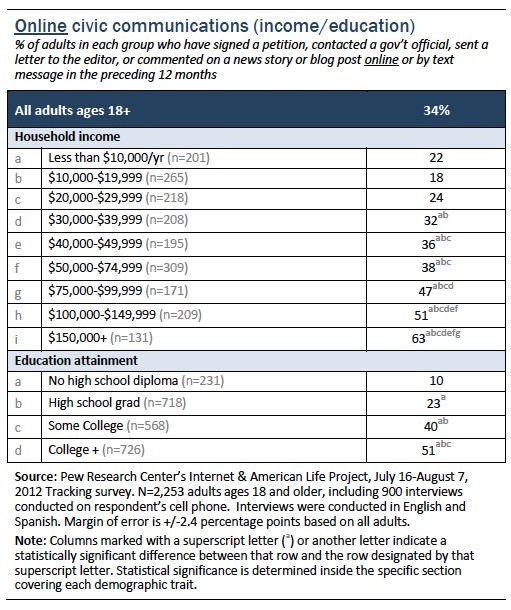
Taken together, 38% of Americans who use the internet or text messaging (representing 34% of all U.S. adults) have done at least one of these activities in the last year. Again, the well-educated and financially better off are significantly more likely than those with lower levels of education or income to speak out about civic issues via digital channels (whites are also more likely to do so than non-whites).
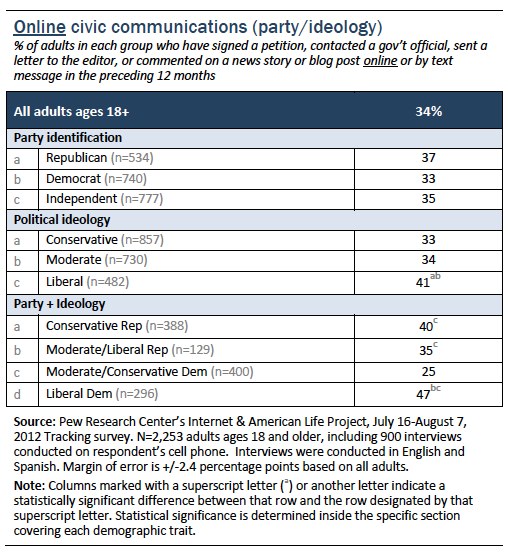
Self-identified liberals who use the internet or text messaging are a bit more likely than conservatives or moderates to engage in at least one of the four modes of online outreach that we measured in our survey. Liberal Democrats and conservative Republicans also stand out on this issue, especially when it comes to contacting a government official online or signing an online petition.
In total, half (50%) of American adults engaged in at least one of these eight online or offline communications behaviors in the year preceding our survey — and of this group, 42% did one of these activities while 58% took part in multiple activities. In particular, the college educated stand out as taking part in a large number of these political communications.
Other types of “digital-only” civic communications
Along with the four “matched pair” civic communications listed above, we also asked two additional questions pertaining specifically to digital interaction that do not correlate directly to offline behaviors:
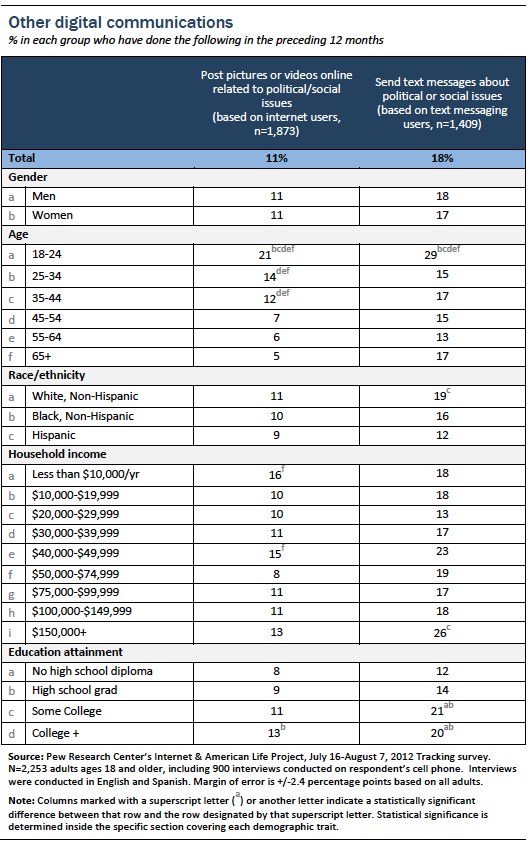
- 11% of internet users have posted pictures or video online related to political or social issues
- 18% of text messaging users have exchanged texts with others about political or social issues
Demographically, younger adults stand out for their use of multimedia and texting around political or social issues, and the college-educated are more likely than those with lower levels of education to share texts about these issues. When it comes to ideological identification, self-identified liberals who use the internet or text messaging are more likely than similar conservatives to post political pictures or videos online (15% vs. 9%) and to share text messages with others about political topics (22% vs. 15%).
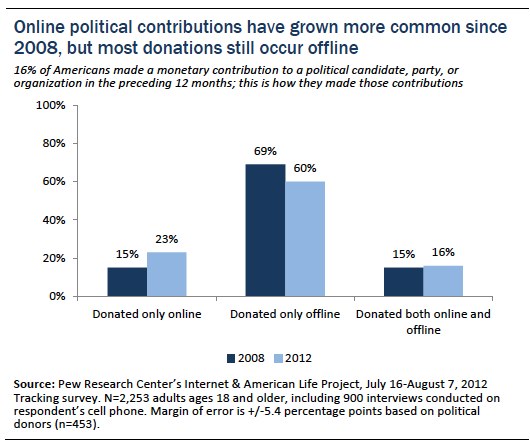
Online political contributions have grown more common since 2008, although offline contributions still dominate.
Some 16% of Americans have made a monetary contribution to a political candidate, party, or other political organization in the 12 months preceding our survey, similar to the 18% of Americans who had done so when we asked this question at a similar point in 2008.
Over that time period, online donations have become more common. Some 23% of political donors in 2012 said they made their contributions only online, compared with 15% who said this in 2008. However, the bulk of political contributors rely primarily on traditional methods of giving (i.e. in person, over the telephone, or via regular mail); some 60% of political donors made only offline contributions in 2012.
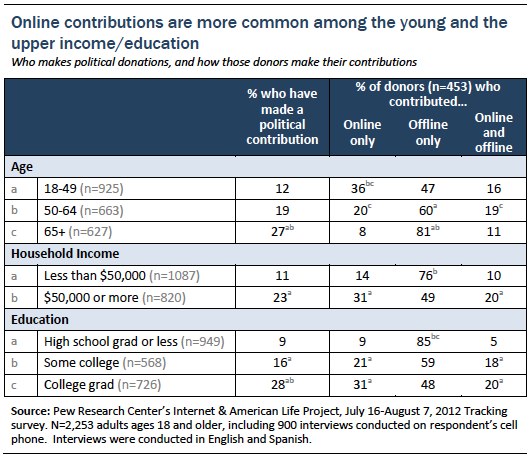
Demographically, contributions to political causes, candidates, or groups are most common among older adults and those with relatively high levels of income and education. Some 28% of college graduates have made political contributions in the preceding year, as have 29% of those with a household income of $75,000 or more per year and 27% of those 65 and older.
Although older adults are more likely to make a political donation in the first place, within the donor population itself, younger donors are more likely than their elders to contribute online — some 36% of political donors ages 18-49 contributed only online, compared with just 8% of donors ages 65 and older who made only online contributions. Online donations are also popular among the more affluent and well-educated cohort of political donors.
And as we have seen with our other research on political campaign contributions, Democrats and Republicans (as well as liberals and conservatives) are equally likely to make contributions in the first place — but Democratic/liberal donors tend to lean toward online contributions, while Republican/conservative donors tend to make their contributions offline, in person, or over the telephone.
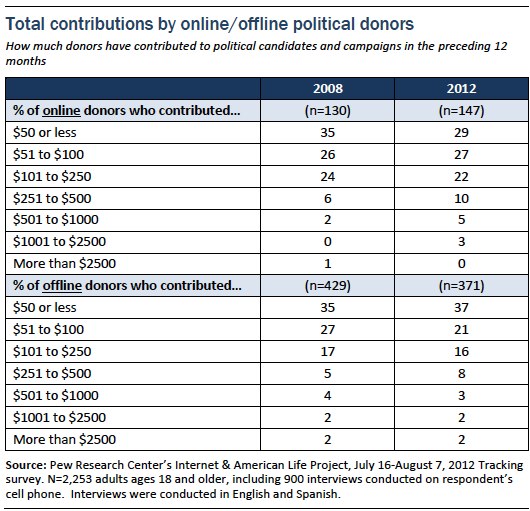
As was the case when we asked this question in 2008, online and offline donors contributed similar amounts of money in 2012 to the candidates and causes they support:
- 56% of online donors (and 58% of offline donors) contributed $100 or less this year to political candidates and campaigns.
- 32% of online donors (and 24% of offline donors) contributed $101-$500.
- 8% of online donors (and 7% of offline donors) contributed more than $500.
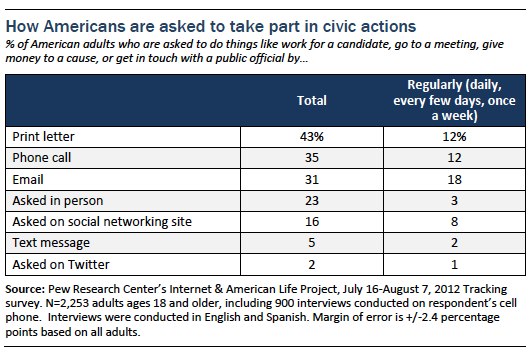
Email and social network users are frequently asked to take part in civic activities within those online spaces.
When questioned about how they get asked by organizations (or other individuals) to take part in political activities — such as donating money, working for a candidate, attending political meetings, or contacting a public official — Americans point toward a wide range of channels through which they receive these requests.
Overall, print letters sent through the regular mail are the most common way by which Americans receive requests to take civic actions (some 43% of Americans receive these requests in the mail at least occasionally), followed closely by email and telephone calls. Requests that occur in the context of social networking sites and in-person interactions are the next most common ways in which people are asked to get involved, followed by requests via Twitter and text message.
However, email is the frontrunner when it comes to “regular” communication (defined here as requests that are received “daily”, “every few days”, or “once a week”). Some 21% of email users regularly get asked on email to take some action around political or social issues (that works out to 18% of all adults), with 6% of email users saying they receive these communications daily. Print letters, phone calls, and requests on social networking sites are also common ways in which Americans are asked to take part in political activities.
Taking all of these communications modes together, some 65% of Americans are contacted at least occasionally by groups or individuals asking them to take some sort of civic action, with 33% saying they receive these requests on a regular basis. As with many of the civic behaviors discussed here, this type of contact is reported more frequently by those with relatively high income and education levels. Some 81% of college graduates report being contacted at least occasionally by others seeking their involvement in political issues (compared with 34% of those who lack a high school diploma), as do 82% of those with an annual household income of $75,000 or more per year (compared with 50% of those earning less than $30,000 per year). And as one might expect from a group with this demographic profile, Americans who receive political mobilization or outreach messages are more likely to take part in a range of political or civic behaviors compared with those with less exposure to these messages.
Looking at the specific types of outreach we measured, conservatives and Republicans were more likely than liberals and Democrats to say they have received political “calls to action” in the mail, while the opposite is true for outreach on social networking sites. Some 52% of Republicans (vs. 43% of Democrats), 50% of conservatives (vs. 40% of liberals), and 60% of conservative Republicans receive political outreach messages via regular mail at least occasionally. On the other hand, liberals and Democrats were more likely than conservatives and Republicans to receive these messages on social networking sites. Some 32% of SNS-using Democrats (vs. 21% of Republicans), 34% of SNS-using liberals (vs. 23% of conservatives), and 41% of liberal Democrats who use these sites have received outreach or mobilization messages within the context of online social networks. Overall, liberals and conservatives are equally likely to say that they receive political communications in one venue or another at least occasionally, while Republicans are slightly more likely (by a 73% to 67% margin) to receive such messages than Democrats.
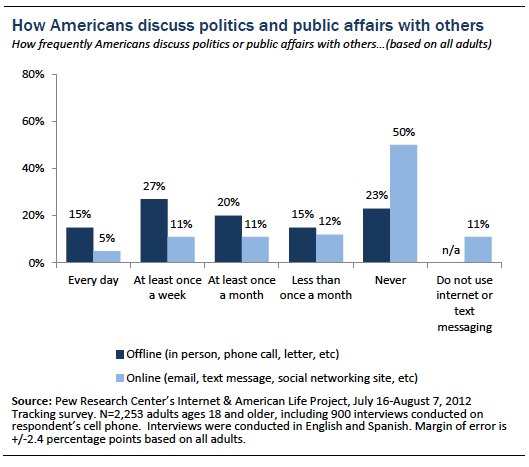
Americans are more likely to chat with friends about political issues offline than online.
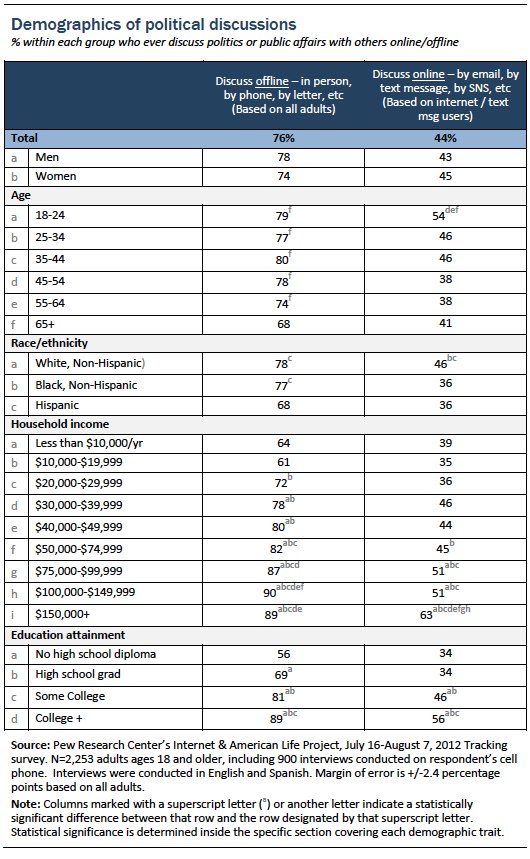
When it comes to more general political “chatter,” eight in ten Americans say they have discussions about politics or public affairs at least occasionally in any venue or locale. And the bulk of those conversations take place in offline spaces such as in-person chats or telephone conversations.
Fully 76% of Americans say they ever discuss politics or public affairs with others in person, by telephone, or by print letter, with 15% of Americans saying they have political discussions in these venues on a daily basis. By way of comparison, some 44% of Americans who use the internet or text messaging say they discuss political issues with others online (such as by email, text message, or on social networking sites), with just 5% saying they have these digital discussions on a daily basis. Indeed, more than half of the entire adult population never has interpersonal discussions around political issues in online or digital spaces — 50% use these platforms but say that they never use them to engage in discussions around politics or public affairs, while an additional 11% do not use any digital communication platforms in the first place.
In a continuation of the themes established throughout this report, the tendency to engage in political discussions tends to rise with one’s income and education level — regardless of whether those discussions occur in physical or digital spaces.