
In the United States, many arts organizations are classified as 501(c)3 nonprofit charities. While they are permitted to generate surplus revenues through their activities, any money earned must be retained by the organization and used for its self-preservation, expansion, or mission-driven work. According to the Urban Institute’s National Center for Charitable Statistics, in 2009 there were 39,719 arts, culture, and humanities nonprofits in the U.S. that accounted for $28.7 billion in revenues.2
The Pew Research Center’s Internet & American Life Project (PIP) designed this survey to understand how arts organizations are using the internet, social media, and other digital technologies to connect with the public. This fits with PIP’s longstanding interest in measuring the impact that the internet is having on the public’s daily life, but is focused specifically on how arts organizations are navigating the changing technological landscape, how it has impacted their mission-driven work, and the challenges and opportunities presented to the field.
Individuals from 3,644 arts organizations who had received grants from the National Endowment for the Arts (NEA) in the past five years were invited to take the survey; 1,244 completed at least part of the survey, which was available online from May 30 to July 20, 2012.3
The vast majority of the organizations taking part in the survey categorized themselves as nonprofits: 84% state they are nonprofits, while 10% say they are arts groups associated with a college or university, and 5% are connected with a state or local government. Only two organizations out of 1,244 classified themselves as for-profit entities.
Nearly three quarters (73%) of organizations that completed the survey have existed for more than 20 years, and another 19% have been around for 11 to 20 years. Only 21 organizations have less than five years of history. This means that the sample is composed of arts organizations with a relatively successful track record and perhaps more able to take advantage of technological advances than all the arts organizations in the country.4
Organizational budgets of the respondents range from less than $50,000 a year to $10 million or more annually, with the largest representation in the $50,000 to $500,000 range. And their staff sizes are relatively small: 46% have five or fewer full-time employees. The survey respondents represent a geographical range, with arts organizations from every state, the District of Columbia, and Puerto Rico.
When asked to describe the community in which their organization is currently based, 70% state they are situated in an urban center. However, answers to subsequent survey questions suggest that arts organizations are using technology to stretch beyond these time-and-place based constraints, with some serving not only their locale, but also communities all over the world.
The scope of services and pursuits of arts organizations in America is vast, from museums and opera companies, to small-scale literary book publishers, to organizations preserving native culture or serving disadvantaged youth. How these organizations use the internet and technology — as well as their access to resources — is as diverse and specialized as their missions.
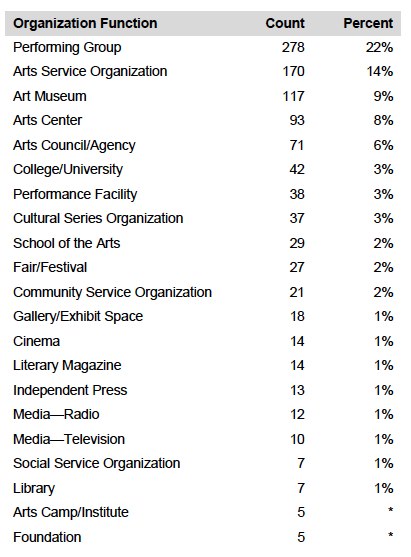
Nearly a quarter of respondents — 22% — say they are a performing group, while another 14% classify themselves as an arts service organization. Seventeen percent of responding organizations place themselves in the “other” category. These organizations describe themselves as performing arts presenters, specific types of museums (history, children’s), gardens and parks, dance troupes, state and local arts councils, multidisciplinary organizations, and others.
Respondents were also asked about the disciplines in which their organizations work. The answers suggest an even mix of visual arts, music, theater, dance, literature, photography, and media arts. No one discipline is over represented.
As far as services offered, participating groups include organizations that curate performances, conduct arts education or media production, support the creation of art, and offer technical support and professional development to the arts community. Far from focusing on one task, 49% of respondents indicate they are providing between four and seven services; 16% of organizations are providing 10 or more different arts-based services.
The arts organizations participating in this survey represent a healthy cross-section of the American arts and culture landscape. These are organizations with significant history that are promoting engagement in a variety of artistic disciplines, and serving artists and audiences in every state.
In the next sections, we will examine the ways that these U.S.-based arts organizations are using the internet and social media.


