In a reflection of changes in the overall economy since the Great Recession, the U.S. unauthorized immigrant workforce now holds fewer blue-collar jobs and more white-collar ones than it did before the 2007-2009 recession, but a solid majority still works in low-skilled service, construction and production occupations, according to new Pew Research Center estimates.
The size of the unauthorized immigrant labor force did not change from 2007 to 2012, but its makeup shifted slightly. The number of unauthorized immigrants in management or professional related jobs grew by 180,000, while the number in construction or production jobs fell by about 475,000, mirroring rises and declines in the overall U.S. economy. The share of all unauthorized immigrant workers with management and professional jobs grew to 13% in 2012 from 10% in 2007, and the share with construction or production jobs declined to 29% from 34%.
Despite these shifts, unauthorized immigrant workers remain concentrated in lower-skill jobs, much more so than U.S.-born workers, according to the new estimates, which are based on government data. In 2012, 62% held service, construction and production jobs, twice the share of U.S.-born workers who did. The 13% share with management or professional jobs is less than half of the 36% of U.S.-born workers in those occupations.
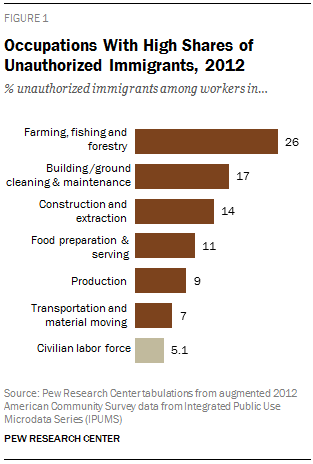
Unauthorized immigrants made up 5.1% of the nation’s labor force in 2012, numbering 8.1 million who were working or looking for work, according to previously published Pew Research estimates (Passel and Cohn, 2014). But as this new analysis shows, they account for a far higher share of the total workforce in specific jobs, notably farming (26%), cleaning and maintenance (17%), and construction (14%).
The unauthorized immigrant share of the work force peaked at 5.4% in 2007, when the two-year Great Recession began.
The number in the labor force has ranged from 8.1 million to 8.3 million since 2007. The relative stability of the size of the unauthorized immigrant labor force since 2007 contrasts with a marked decline in the overall U.S. unauthorized immigrant population, which peaked at 12.2 million in 2007, dropped through 2009 and stabilized after that, to total 11.2 million in 2012 (Passel and Cohn, 2014).
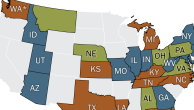
The unauthorized immigrant share of the workforce varies markedly by state; states with higher unauthorized immigrant populations also tend to have higher shares of unauthorized immigrants in the labor force. The states whose labor forces have the highest shares of unauthorized immigrants are Nevada (10.2% in 2012), California (9.4%) and Texas (8.9%) (Passel and Cohn, 2014).
Occupation and Industry: What’s the Difference?
This report on the unauthorized immigrant workforce includes estimates about occupation, which is the kind of work that people do on the job, as well as about industry, which is the kind of business conducted by an employing organization.
Some occupation groups are similar to industry categories—for example, many construction workers are employed in the construction industry. The construction industry, however, also employs people in many other occupations, such as manager, clerk, etc.
The Census Bureau obtains data on occupation and industry from responses to write-in and check-box questions; the responses are coded using a standard classification system.
The new Pew Research Center analysis also shows that in most states—39, plus the District of Columbia—the largest number of unauthorized immigrant workers are found in service occupations, which include maids, cooks or groundskeepers.1 Construction and production occupations also have large representation of unauthorized immigrant workers in many states, according to the new Pew Research analysis. However, when looking at the occupation in which unauthorized immigrant employees are the highest share of the workforce, in most states, it is farming.2
There is more variation among states in the industries that employ the most unauthorized immigrants. Leisure and hospitality is the largest industry among unauthorized immigrant workers in 14 states and the District of Columbia, generally in the West or Northeast, as well as Florida. In 11 states, which tend to be in the South, the construction industry employs more unauthorized immigrants than any other. Manufacturing is the dominant employer of this group in 11 states, largely in the Midwest.
See the appendix for tables that show the top occupations (Table A1) and industries (Table A3) for unauthorized immigrants in each state.
In 2012, unauthorized immigrants accounted for 3.5% of the U.S. population and 26% of all immigrants. Unauthorized immigrants make up a larger share of the labor force than of the overall population. A key reason for that is that they are more likely than the overall U.S. population to be of working age, and less likely to be young or older (Passel and Cohn, 2009).
Previous work by the Pew Research Center has found that unauthorized immigrants are far less educated, on average, than legal immigrants or the U.S.-born; they are both more likely not to have graduated high school and less likely to have attended college. That, and limits due to their status, helps explain their concentration in low-skilled occupations (Passel and Cohn, 2009).
The unauthorized immigrant estimates throughout this report are produced using a multistage method that subtracts the legal foreign-born population from the total adjusted foreign-born population; the residual then is used as the source of information about unauthorized immigrants.
The main source of data for estimates since 2005 is the U.S. Census Bureau’s American Community Survey; estimates for 1995 and 2000 use the bureau’s March Current Population Survey.
This report includes two chapters, four maps and detailed appendix tables. The first chapter analyzes the occupations of unauthorized immigrants, compares them with those of U.S.-born workers, examines trends from 2007 to 2012, and discusses differences in dominant occupations by state. The second chapter does the same for industries in which unauthorized immigrants work. Accompanying this report is written testimony by Jeffrey S. Passel, senior demographer, for a March 26, 2015, hearing of the U.S. Senate Committee on Homeland Security and Governmental Affairs.
About This Report
This report provides estimates of the 2012 unauthorized immigrant workforce in the United States, by occupation and industry category, as well as trends since 2007. It provides some comparisons with industry and occupation categories of U.S.-born and legal immigrant workers. The report also includes 2012 estimates of the occupation and industry categories of unauthorized immigrant workers for 43 states and the District of Columbia. In addition to the text, there are extensive appendix tables with detailed data, as well as four maps.
This report was written by Jeffrey S. Passel, senior demographer, and D’Vera Cohn, senior writer. Editorial guidance was provided by Claudia Deane, vice president, research; and Mark Hugo Lopez, director of Hispanic research. Renee Stepler, research assistant, created charts and tables. Michael Keegan, information graphics designer, created the maps. Eileen Patten, research analyst, number-checked the graphics and text. Molly Rohal copy edited the report. All are on the staff of the Pew Research Center.
The estimates shown in this report use the “residual method,” a widely accepted and well-developed technique based on official government data for estimating the size and characteristics of the nation’s unauthorized immigrant population. The data come mainly from the American Community Survey, conducted by the Census Bureau. For more detail, see Methodology.
Find related reports online at pewresearch.org/pewresearch-org/hispanic.
A Note on Terminology
“Foreign born” refers to an individual who is not a U.S. citizen at birth or who, in other words, is born outside the U.S., Puerto Rico or other U.S. territories and whose parents are not U.S. citizens. The terms “foreign born” and “immigrant” are used interchangeably. “U.S. born” refers to an individual who is a U.S. citizen at birth, including people born in the United States, Puerto Rico or other U.S. territories, as well as those born elsewhere to parents who are U.S. citizens.
The “legal immigrant” population is defined as people granted legal permanent residence; those granted asylum; people admitted as refugees; and people admitted under a set of specific authorized temporary statuses for longer-term residence and work. This group includes “naturalized citizens,” legal immigrants who have become U.S. citizens through naturalization; “legal permanent resident aliens” who have been granted permission to stay indefinitely in the U.S. as permanent residents, asylees or refugees; and “legal temporary migrants” (including students, diplomats and “high-tech guest workers”) who are allowed to live and, in some cases, work in the U.S. for specific periods of time (usually longer than one year).
“Unauthorized immigrants” are all foreign-born non citizens residing in the country who are not “legal immigrants.” These definitions reflect standard and customary usage by the U.S. Department of Homeland Security and academic researchers. The vast majority of unauthorized immigrants entered the country without valid documents or arrived with valid visas but stayed past their visa expiration date or otherwise violated the terms of their admission. Some who entered as unauthorized immigrants or violated terms of admission have obtained work authorization by applying for adjustment to legal permanent status, obtaining Temporary Protected Status (TPS) or receiving Deferred Action for Childhood Arrivals (DACA) status. This “quasi-legal” group could account for as much as 10% of the unauthorized population. Many could also revert to unauthorized status.
The “labor force” refers to people ages 16 and older who are employed or looking for work. “Workforce” is used interchangeably with labor force. Similarly, when there is analysis of estimates for occupations, “occupation” and “job” are used interchangeably. And for industries, “industry” and “sector” are used interchangeably.
The occupation and industry category titles used throughout the report have been shortened for display purposes. The full list is included in the Methodology appendix.