I. Overview

The annual inflow of unauthorized immigrants to the United States was nearly two-thirds smaller in the March 2007 to March 2009 period than it had been from March 2000 to March 2005, according to new estimates by the Pew Hispanic Center, a project of the Pew Research Center.
This sharp decline has contributed to an overall reduction of 8% in the number of unauthorized immigrants currently living in the U.S.—to 11.1 million in March 2009 from a peak of 12 million in March 2007, according to the estimates. The decrease represents the first significant reversal in the growth of this population over the past two decades.1

The Pew Hispanic Center’s analysis also finds that the most marked decline in the population of unauthorized immigrants has been among those who come from Latin American countries other than Mexico. From 2007 to 2009, the size of this group from the Caribbean, Central America and South America decreased 22%.
By contrast, the Mexican unauthorized population (which accounts for about 60% of all unauthorized immigrants) peaked in 2007 at 7 million and has since leveled off. The number of unauthorized immigrants from the rest of the world did not change.
Even though the size of the Mexican unauthorized population living in the United States has not changed significantly since 2007, the inflows from that country have fallen off sharply in recent years. According to the center’s estimates, an average of 150,000 unauthorized immigrants from Mexico arrived annually during the March 2007 to March 2009 period—70% below the annual average of 500,000 that prevailed during the first half of the decade.
The recent decrease in the unauthorized population has been especially notable along the nation’s Southeast coast and in its Mountain West, according to the new estimates. The number of unauthorized immigrants in Florida, Nevada and Virginia shrank from 2008 to 2009. Other states may have had declines, but they fell within the margin of error for these estimates.

Not counting Florida and Virginia, the unauthorized immigrant population also declined in the area encompassing the rest of the South Atlantic division that extends between Delaware and Georgia.2 In addition to the decline in Nevada, three other Mountain states—Arizona, Colorado and Utah—experienced a decrease in their combined unauthorized immigrant population from 2008 to 2009.
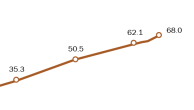
As shown in the accompanying chart, there may have been a decline in the unauthorized population between 2008 (11.6 million) and 2009 (11.1 million), but this finding is not conclusive because of the margin of error in these estimates.
Comparison with Previous Estimates
Estimates presented here for size and characteristics of the unauthorized immigrant population replace those previously published by the Pew Hispanic Center for 2000 to 2008. Methodological changes in the underlying Census Bureau data necessitated reweighting to allow for consistent measures across years. General trends over time are similar and differences tend to be small, but users are cautioned that previous estimates should not be compared with those in this report.
Despite the recent decline, the population of unauthorized immigrants was nearly a third larger (32%) in 2009 than in 2000, when it numbered 8.4 million. The size of this group has tripled since 1990, when it was 3.5 million.
During the first half of the decade, an average of about 850,000 new unauthorized immigrants entered each year, increasing the unauthorized population from 8.4 million in 2000 to 11.1 million in 2005. Since then, the average annual inflow dropped to about 550,000 per year from March 2005 to March 2007 and declined further to an average of 300,000 per year for March 2007 to March 2009. As a result, the unauthorized population in 2009 returned to the level it had been in 2005.
The unauthorized population is not a static group of people. Each year, some unauthorized immigrants arrive and some return to their countries of origin. This population can also be reduced by deaths or by conversions to legal status.
Our method of analysis does not permit a precise estimation of how many in this population emigrate, achieve legal status or die. The underlying data are consistent with a previous Pew Hispanic Center report that found a sharply decreased flow of immigrants from Mexico to the United States since mid-decade but no evidence of a recent increase in the number of Mexican-born migrants returning home from the U.S. However, return flows to other countries may have increased.
Our method of analysis does not permit a precise estimation of how many in this population emigrate, achieve legal status or die. The underlying data are consistent with a previous Pew Hispanic Center report that found a sharply decreased flow of immigrants from Mexico to the United States since mid-decade but no evidence of a recent increase in the number of Mexican-born migrants returning home from the U.S. However, return flows to other countries may have increased.
Other main findings of this report include:
- Unauthorized immigrants accounted for 28% of the nation’s foreign-born population in 2009, a decline from 31% in 2007.
- Mexico accounted for 60% of unauthorized immigrants in 2009, or 6.7 million people. Other Latin American nations accounted for 20% of the total, or 2.2 million people. South and East Asia accounted for 11% of the total, or 1.2 million people.
- In 2009, 59% of unauthorized immigrants resided in California, Texas, Florida, New York, Illinois and New Jersey. However, the share living in those states has declined from 80% in 1990, as unauthorized immigrants have dispersed to new settlement areas.
- Nearly half of unauthorized immigrants living in the country in 2009—47%, or 5.2 million people—arrived in 2000 or later.
- The number of male unauthorized immigrants peaked in 2007 at 6.3 million and declined to 5.8 million in 2009. The number of female unauthorized immigrants, 4.2 million in 2009, is roughly the same as it was in 2007.
- The number of children who are unauthorized, 1.1 million in 2009, declined slightly over the decade. By contrast, the population of U.S.-born children with at least one unauthorized parent nearly doubled from 2000 to 2009, when they numbered 4 million.
- There were 7.8 million unauthorized immigrants in the labor force in 2009, or 5.1% of the total. The size of the unauthorized labor force peaked in 2007 and declined in both 2008 and 2009. There were 7 million unauthorized immigrants employed in March 2009.
- States with the largest shares of immigrants in the labor force are Nevada (9.4%), California (9.3%), Texas (8.7%) and New Jersey (8.7%).
- The unemployment rate for unauthorized immigrants of all ages in March 2009 was higher than that of U.S.-born workers or legal immigrants—10.4%, 9.2% and 9.1%, respectively.
About this Report
This report estimates the size of the unauthorized immigrant population, as well as the unauthorized immigrant labor force for the nation and each state in March 2009. For the nation, it also describes this population by region or country of birth, arrival period, gender and age. For some of these variables, the report estimates annual trends from 2000 onward. Expanding on an earlier report about U.S.-born children of unauthorized immigrants, the report provides estimates and trends for the status of children of unauthorized immigrants.
The Pew Hispanic Center estimates the unauthorized immigrant population using the “residual method,” a well-developed and widely accepted technique that is based on official government data. Under this methodology, a demographic estimate of the legal foreign-born population—naturalized citizens, legal permanent residents, temporary legal residents and refugees—is subtracted from the total foreign-born population. The remainder, or residual, is the source of population estimates and characteristics of unauthorized immigrants.
These Pew Hispanic Center estimates use data mainly from the Current Population Survey (CPS), a monthly survey of about 55,000 households conducted jointly by the U.S. Bureau of Labor Statistics and the Census Bureau. It is best known as the source for monthly unemployment statistics. Each March, the CPS sample size and questionnaire are expanded to produce additional data on the foreign-born population and other topics. The Pew Hispanic Center estimates make adjustments to the government data to compensate for undercounting of some groups, and therefore its population totals differ somewhat from the ones the government uses. Estimates for any given year are based on a March reference date.
These Pew Hispanic Center estimates use data mainly from the Current Population Survey (CPS), a monthly survey of about 55,000 households conducted jointly by the U.S. Bureau of Labor Statistics and the Census Bureau. It is best known as the source for monthly unemployment statistics. Each March, the CPS sample size and questionnaire are expanded to produce additional data on the foreign-born population and other topics. The Pew Hispanic Center estimates make adjustments to the government data to compensate for undercounting of some groups, and therefore its population totals differ somewhat from the ones the government uses. Estimates for any given year are based on a March reference date.
Overall, the 2007 and 2008 revisions are not large, but because they were disproportionately concentrated among groups with large foreign-born shares—especially Hispanics—they somewhat affected the residual estimates of the unauthorized population. Moreover, accurate assessments of year-to-year change require a consistent set of population figures across years. The largest impact of the revised population estimates on the Pew estimates of unauthorized immigrants are in 2007 and 2008. For those two years, the new figures for unauthorized immigrants are about 3% lower than the previous estimates. For 2000-2006, the revisions are smaller in magnitude and not all in the same direction. For more detail, see the Methodology appendix.
A Note on Terminology
“Foreign born” refers to an individual who is not a U.S. citizen at birth or, in other words, who is born outside the U.S., Puerto Rico or other U.S. territories and whose parents are not U.S. citizens. The terms “foreign born” and “immigrant” are used interchangeably.
“U.S. born” refers to an individual who is a U.S. citizen at birth, including people born in the United States, Puerto Rico or other U.S. territories, as well as those born elsewhere to parents who are U.S. citizens.
The “legal immigrant” population is defined as people granted legal permanent residence; those granted asylum; people admitted as refugees; and people admitted under a set of specific authorized temporary statuses for longer-term residence and work. This group includes “naturalized citizens,” legal immigrants who have become U.S. citizens through naturalization; “legal permanent resident aliens” who have been granted permission to stay indefinitely in the U.S. as permanent residents, asylees or refugees; and “legal temporary migrants” who are allowed to live and, in some cases, work in the U.S. for specific periods of time (usually longer than one year).
“Unauthorized immigrants” are all foreign-born non-citizens residing in the country who are not “legal immigrants.” These definitions reflect standard and customary usage by the Department of Homeland Security and academic researchers. The vast majority of unauthorized immigrants entered the country without valid documents or arrived with valid visas but stayed past their visa expiration date or otherwise violated the terms of their admission. Some who entered as unauthorized immigrants or violated terms of admission have obtained work authorization by applying for adjustment to legal permanent status or by obtaining Temporary Protected Status (TPS). Data are very limited, but this “quasi-legal” group could account for as much as 10% of the unauthorized population. Many could also revert to unauthorized status.
“Children” are people under age 18 who are not married. “Adults” are ages 18 and older.
“Children of unauthorized immigrants” or “children of unauthorized immigrant parents” include both foreign-born and U.S.-born children who live with at least one unauthorized immigrant parent.