Labor market trends from 2000 to 2004, a period encompassing a recession, an extended economic slowdown and the start of a recovery, also revealed no consistent relationship across all states between changes in the foreign-born workforce and employment outcomes for native-born workers.
The average native-born employment rate across the 50 states and the District of Columbia was 63.3% in 2004, two percentage points below the average for 2000. It ranged from 71.8% in Nebraska to 51.3% in West Virginia. The overall decline in employment rates since 2000 is not surprising in view of the recession and economic slowdown that prevailed for most of 2000 to 2004. The average growth in the foreign-born workforce from 2000 to 2004 across the 51 areas was 17%, with the largest increase in Tennessee (43%) and the lowest in West Virginia (- 23%). Table A2 in Appendix A presents data on all the states.
Again, as was the case in 2000, there was no relationship between the growth of the foreign-born population between 2000 and 2004 and the employment rate for native-born workers in 2004. Evidence on the lack of a relationship is summarized in Table 5, which shows employment rates and changes in the foreign-born population in four groups of states.

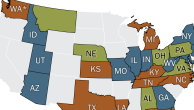
The lack of a relationship between the growth in the foreign-born population and outcomes for native-born workers emerges more clearly when individual states are plotted on a chart that maps the change in the foreign-born population from 2000 to 2004 and the native-born employment rate in each state in 2004 (Figure 2). The central point in Figure 2 is the simple averages of changes in the foreign-born workforce (17%) between 2000 and 2004 and employment rates (63.3%) in 2004.
The four quadrants in Figure 2 correspond with the four groups of states presented in Tables 5 above. Two of these quadrants—(FB +, NB ─) and (FB ─, NB +)— represent groups of states where changes in the foreign-born workforce may have had a negative impact on employment outcome for native-born workers. States that lie in the other two quadrants—(FB +, NB +) and (FB ─, NB ─)—had experiences that were consistent with a positive relationship between growth in the foreign-born workforce and employment outcomes for the native born.
The 50 states and the District of Columbia are spread evenly across the four quadrants in Figure 2, evidence that there was no consistent relationship between the growth of the foreign-born population between 2000 and 2004 and the employment rates for native-born workers in 2004. The same can be said about the labor force participation rate and the unemployment rate for the native born in 2004 (see Table A2 and Figures A3 and A4 in Appendix A).
A Negative Correlation with the Foreign-Born Workforce
There were 23 states where changes in the foreign-born population had a negative relationship with the employment rate of native-born workers (Table 5 and Figure 2). Those states accounted for 33% of the native-born workforce in 2004.
The lower-right quadrant of Figure 2 represents states with above-average growth in the foreign-born population (FB +) and below-average employment rates for native-born workers (NB ─). The upper-left quadrant represents states with below-average growth in the foreign-born population (FB ─) and above-average employment rates for the native-born (NB +).
There were 11 states in 2004—three more than in the comparable category in 2000—in which the growth in the foreign-born population was above average and the employment rate for the native-born population was below average. Georgia, which had an employment rate for native-born workers of 63.1%, was at the top of the list and Alabama, with an employment rate of 58%, was at the bottom.

Other states in the lower-right quadrant are Michigan, North Carolina, Oklahoma, New Mexico, Arizona, South Carolina, Tennessee, Arkansas and Kentucky. The growth of the foreign-born population ranged from 17% in New Mexico to 43% in Tennessee, which was two and a half times the 17% average across all 50 states and the District of Columbia.
There were 12 states in which the growth of the foreign-born workforce was less than average and the employment rate for native-born workers was above average (the upper-left quadrant in Figure 2). That is four fewer states than in the comparable category in 2000. Nebraska, with an employment rate of 71.8% in 2004, was at the top of the list and Connecticut, with an employment rate of 63.3%, was at the bottom.
Other states in this group are South Dakota, Vermont, Kansas, Utah, Iowa, Alaska, Massachusetts, Montana, Maine and Washington. The growth in the foreign-born population ranged from -8% in Montana to 16% in Nebraska and Washington.
The experiences of the 23 states in the lower-right (FB +, NB ─) and upper-left (FB ─, NB+) quadrants indicate that the growth in the foreign-born workforce may have had a harmful impact on native-born workers. However, the opposite is true for the remaining 27 states and the District of Columbia.
A Positive Correlation with the Foreign-Born Workforce
In 27 states and the District of Columbia, changes in the foreign-born population between 2000 and 2004 had a positive relationship with the employment rate of native-born workers in 2004. Those states accounted for 67% of the native-born workforce.
The upper-right quadrant in Figure 2 represents states with above-average foreign population growth (FB +) and above-average employment rates for native-born workers (NB +). The lower-left quadrant represents states with below-average foreign population growth (FB ─) and below-average employment rates for native-born workers (NB ─).
There were 13 states in 2004—one more than in 2000—in which both the growth of the foreign-born workforce and native-born employment rates were above average. Together, the states in the upper-right quadrant in Figure 2 represented 17% of the native-born workforce in 2004. Six of those states also appeared on the comparable group in 2000.
Minnesota again was at the top of the list, followed by North Dakota, Colorado, Wyoming, New Hampshire, Wisconsin, Maryland, Idaho, Missouri, Indiana, Virginia, Nevada and Delaware. The growth of the foreign-born population in that grouping ranged from 18% in Maryland to 38% in Delaware, which was more than double the average across all states (17%).
In 14 other states and in the District of Columbia, both the change in the foreignborn workforce between 2000 and 2004 and the employment rate for native-born workers in 2004 were below average. Those states and the District of Columbia accounted for 50% of the nation’s native-born workforce and include the traditional migrant states of California, New York, New Jersey, Illinois, Texas and Florida. Rhode Island, which led the states in this category both in 2000 and 2004, had a native-born employment rate of 62.8% in 2004. As was the case in 2000, West Virginia again had the lowest employment rate for native-born workers (51.3%).
The other states in the lower-left quadrant in 2004 are Hawaii, Ohio, Pennsylvania, Oregon, Mississippi and Louisiana. Eleven of the states and the District of Columbia also appeared on the comparable list in 2000, which had the District of Columbia and 12 states, including New Mexico. The growth of the foreign-born population in 2004 ranged from -23% in West Virginia to 16% in Texas, Pennsylvania and Florida, which was one percentage point shy of the average across all states.
In conclusion, the evidence in Table 5 and Figure 2 shows that there was no relationship between the growth of the foreign-born population between 2000 and 2004 and the employment rates for native-born workers 16 and older in 2004. The same conclusion emerges with respect to the labor force participation rate and the unemployment rate for the native born in 2004 (see Figures A3 and A4 in Appendix A). Thus, two very different sets of economic circumstances—the record expansion of the 1990s and the recessionary period since 2000—produce no clear evidence of an association between the growth in the foreign-born population and employment prospects for native-born workers.