This Pew Research Center report on sources of national pride uses data from nationally representative surveys conducted in 25 countries.
For non-U.S. data, this analysis draws on nationally representative surveys of 28,333 adults conducted from Jan. 8 to April 26, 2025. Surveys were conducted over the phone with adults in Canada, France, Germany, Greece, Hungary, Italy, Japan, the Netherlands, Poland, South Korea, Spain, Sweden and the United Kingdom. They were conducted face-to-face in Argentina, Brazil, India, Indonesia, Israel, Kenya, Mexico, Nigeria, South Africa and Turkey. In Australia, we used a mixed-mode probability-based online panel. All responses are weighted to be representative of the adult population in each country. Read more about international survey methodology.
In the United States, we surveyed 5,153 adults from Aug. 18 to 24, 2025. Everyone who took part in this survey is a member of the Center’s American Trends Panel (ATP), a group of people recruited through national, random sampling of residential addresses who have agreed to take surveys regularly. This kind of recruitment gives nearly all U.S. adults a chance of selection. Surveys were conducted either online or by telephone with a live interviewer. The survey is weighted to be representative of the U.S. adult population by gender, race, ethnicity, partisan affiliation, education and other categories. Read more about the ATP’s methodology.
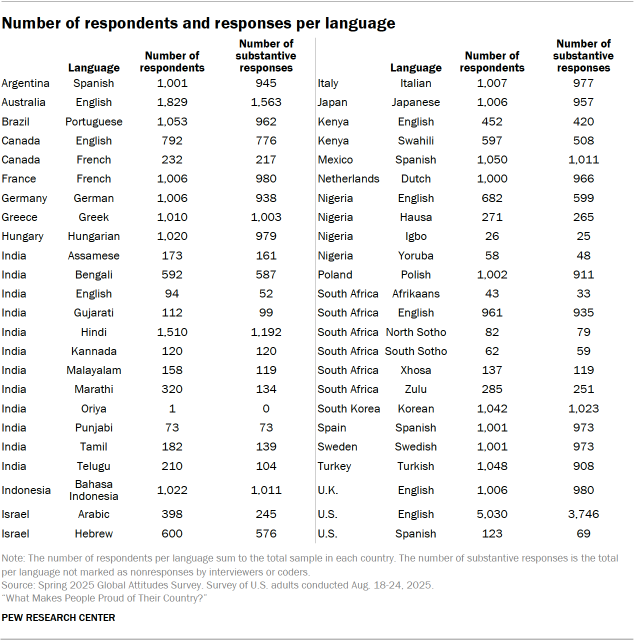
Respondents in all countries were asked the following question: “What makes you feel proud of (survey country)? Please share as much detail as you would like.” For interviewer-administered surveys, responses were transcribed by interviewers in the language in which the interviews were conducted. More than 20,000 non-English substantive responses were collected in 35 different languages. They were translated by cApStAn, a professional translation firm.
In the U.S., respondents were then asked “And is there anything that makes you not feel proud of the United States? Please share as much detail as you would like.” In the 297 cases where respondents returned to the original question and modified their response, researchers analyzed the nature of the change:
- If the modification changed the valence of the original response, such as switching it from negative to positive, we kept the original response.
- If the modification provided a response after initially declining to answer, or if it lengthened or otherwise added detail to the original, we used the updated response.
In the sections that follow, we detail how we coded these responses to use for analysis, as well as properties of the responses.
Codebook development
To develop a codebook that captures the main things that bring people pride across the 25 countries surveyed, six Center researchers iteratively reviewed random samples of English responses and non-English responses that were translated. These samples did not include U.S. responses, given the delayed field period. U.S. responses were coded to the codebook developed with these samples from the 24 other countries surveyed.
Researchers mapped out the key concepts that commonly appeared in the first sample of responses using open coding. After developing an initial codebook, researchers tested it on multiple random samples of a minimum of 120 responses to evaluate the codebook’s conceptual validity. After each round, they reviewed disagreements and refined the codebook before testing it again on another sample.
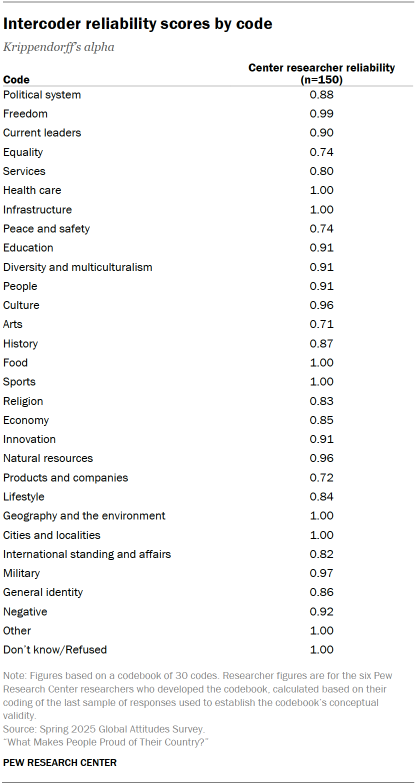
After four iterations of this process, researchers were able to determine that the codebook was clear enough for other coders to independently apply in a consistent manner. The codebook’s overall intercoder reliability, assessed by calculating Krippendorff’s alpha, was at least 0.70 for each of the 30 codes in the codebook. For the full codebook, refer to Appendix C.
Coding responses
To code the full set of responses, researchers trained seven additional Center coders to apply the codebook independently, using the intercoder reliability scores measured during codebook development as a benchmark of acceptable performance. Each coder was given a sample of 150 responses, drawn from the samples of responses that the researchers involved in codebook development had already coded and agreed on.
The additional coders were then evaluated for intercoder reliability against the coding results from Center researchers and were cleared to begin coding the full queue of responses. Those below 0.70 on any code were given additional feedback and, when needed, more samples of responses until they could apply the codebook independently.
Each researcher and additional coder from the Center coded between 959 and 7,786 responses. In total, 29,810 substantive responses in 36 different languages from 25 different countries were coded. (For more on nonresponse, go to Characteristics of the responses.)
Collapsing codes for analysis
The original codebook for this analysis contains 30 unique codes applied to each unit of information in responses. After coding was complete, Center researchers chose to treat “arts” and “culture” as one code for analysis.
Characteristics of the responses
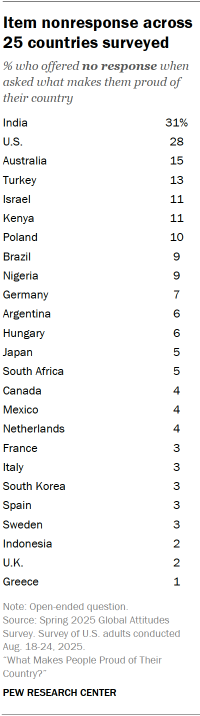
Item nonresponse – the rate at which respondents say they “don’t know” or refuse to answer the question – varies across the 25 countries included in the survey. In about half the countries surveyed, just 5% or fewer did not provide an answer to the open-ended question, while 31% did not respond in India and 28% did not respond in the U.S. Additionally, one-in-ten or more did not answer the question in Australia, Turkey, Israel, Kenya and Poland.
Previous research has established that item nonresponse can be higher for open-ended questions than for closed-ended questions, which have a pre-fixed set of response options. Item nonresponse is also relatively high in the countries where we use web panels: the U.S. and Australia. Younger respondents in those countries are especially likely to not provide an answer.
People with lower levels of formal education were more likely not to answer the question in several countries surveyed, regardless of mode.
Countries also vary in how much detail the average respondent provided in a substantive response. For example, Spanish responses in Spain averaged 22 words, more than double the eight words in the average Spanish response in Argentina. While this particular gap may be attributable to mode differences – responses in Spain were collected over the phone, while responses in Argentina were collected in person – response length also varies between the publics that were surveyed in person. In Mexico, where the survey was also administered in Spanish and face-to-face, people provided an average of 14 words.
Whether due to mode or to cultural, demographic or other factors, variation in response length ultimately manifests as variation in the number of topics mentioned in a given substantive response. For example, across the 25 countries surveyed, a median of 54% mentioned only one topic in our codebook (e.g., diversity and multiculturalism). The share in South Korea is much higher, with 76% of those who answered the question suggesting only one source of pride. In comparison, about three-in-ten or more mention two topics in Canada, Hungary, Indonesia, Japan, Mexico, the Netherlands and South Africa. And in some countries it is common to mention even more sources of pride: 63% in Sweden and 54% in France name three or more sources of pride in their responses.
These differences help explain why the share giving a particular answer in certain publics may appear much lower than others, even if it is the top-ranked source of pride. To give a specific example, 41% of respondents in Japan mention the people as a source of pride, while 20% do so in Turkey – yet the topic is ranked first in both countries. Given this discrepancy, researchers have chosen to analyze both the share of the public that mentions a given topic as well as its relative ranking among all topics coded.
Selection of quotes
Open-ended responses included in the report – both originally recorded in English and professionally translated – have been edited for clarity. They have been purposefully – not randomly – selected to illustrate key points and may not be representative of all responses for a given public. Quotes may also have been shortened in the report for brevity. Our analysis is not a fact check of participants’ views.