

One reality of the polling world is item nonresponse — that is, when survey takers decline to answer certain questions. But nonresponse rates can vary considerably depending on the kinds of questions that are asked.
The existing research literature shows that closed-ended questions, or those with a fixed set of response options, result in lower nonresponse rates than open-ended questions, which allow respondents to answer a question in their own words. This is true regardless of survey mode, such as online versus phone. Consider a respondent who takes a survey online: It is much easier and less time-consuming to choose an option from a multiple-choice list than to come up with a response in one’s own words and then type it out on a phone or a computer.
In Pew Research Center’s online American Trends Panel (ATP) — which, by and large, asks different flavors of questions across a wide variety of topics — it is uncommon to see item nonresponse rates that exceed 4%. The average nonresponse rate for closed-ended questions on the ATP hovers between 1% and 2%, and closed-ended questions, on average, make up more than 95% of questions on a typical ATP survey wave.
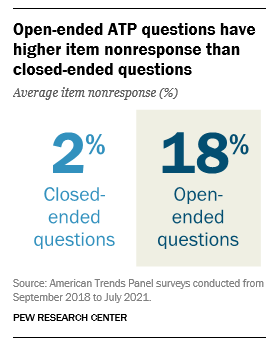
But the plot twists slightly when open-ended questions are asked on the ATP. Double-digit item nonresponse rates are common for open-ended questions, with the average hovering around 18% and rates for specific questions ranging from as low as 3% to just over 50%. With such a wide range of item nonresponse rates for open ends, we sought to understand what drives these differential rates, and if possible, figure out how to encourage greater response.
Some research suggests that the general question type — such as whether it is asking about a fact, attitude or behavior — can influence the item nonresponse level. In this piece, we examine the nature of open-ended questions to see if certain features yield higher or lower levels of item nonresponse. We also explore whether item nonresponse differs for those question characteristics depending on the device type being used to complete the survey, such as a mobile device or a desktop computer. (In a typical ATP wave, about 60% of respondents respond using a mobile device.)
The aim of this analysis is not to make a case for excluding open ends because of their comparatively higher item nonresponse rates. In fact, we support using them in large-scale quantitative surveys (not just qualitatively) for the additional texture they can provide, as well as the statistical gain in representativeness, which may allow for other methodological analyses. For researchers who have concerns about nonresponse rates on open-ended questions, we hope to show techniques for crafting questions that may minimize item nonresponse, or at the very least, set expectations for when open-ended questions are included in surveys.
What we did
We took three main steps to gather and prepare the data for this exercise. The first required identifying all open-ended questions asked across more than 40 ATP surveys fielded between September 2018 and July 2021. This yielded 92 open-ended questions. Second, we computed the item nonresponse rate for each question. The third step was more qualitative in nature: We identified relevant question characteristics — which we also call “dimensions” — that may influence whether people answer an open-ended question. For each of the 92 open-ended questions, we coded the following dimensions.
- Requested answer length. Does the question ask for a few words or more than that?
- Level of cognitive burden. Is the question easy to answer or does it require deep thought?
- Political focus. Is the question about politics?
We explain each of these three dimensions in more detail below.
Requested answer length
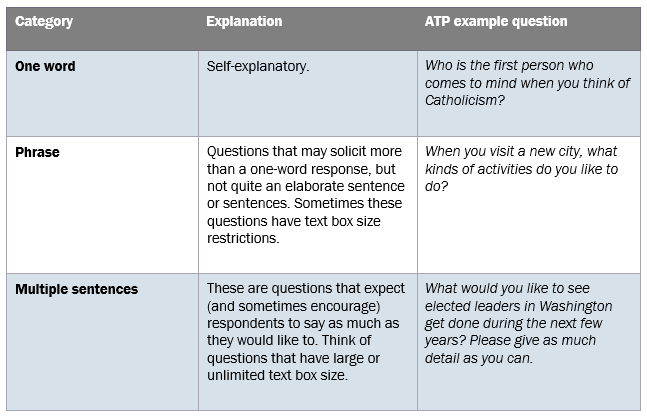
Questions asking for lengthy responses may elicit higher refusal rates than questions asking for short answers. The cues for expected response length can be explicit or implied. For example, a question beginning with the phrase “In a sentence or two…” signals to the respondent that they are expected to write more than one word.
This dimension has three categories: one word, phrase and multiple sentences. In this analysis, one-word response type questions make up roughly 17% of open-ended questions, while phrase questions make up 35%. The largest share (48%) solicit multiple sentences.
Cognitive burden
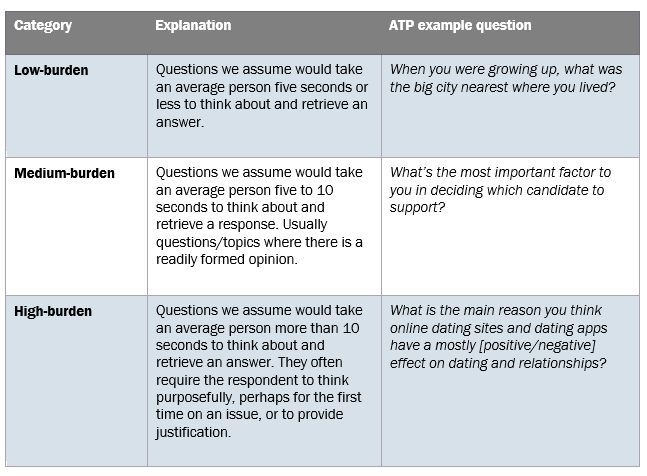
Cognitive burden refers to whether a question is relatively easy or hard to answer. Previous research has shown that questions that demand more from respondents cognitively are also questions with higher rates of item nonresponse. Cognitive burden is a difficult concept to measure practically, so we tried to capture it with estimated response time.
There are three categories for this dimension: low-, medium- and high-burden. Based on the sample of ATP open-ended questions in this analysis, most are medium-burden (43%) or high-burden (47%). Only 10% are low-burden questions.
Political focus
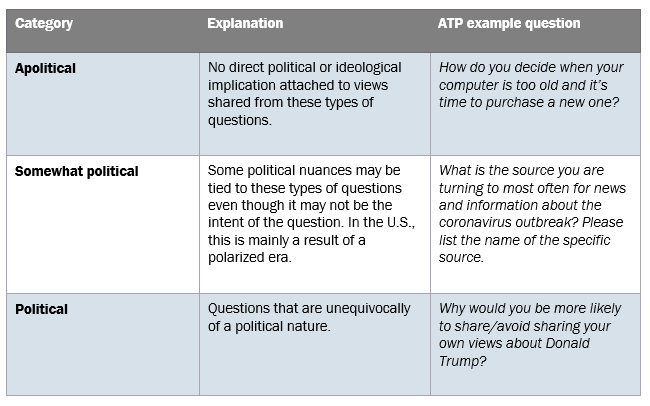
This dimension is for questions that touch on somewhat controversial or sensitive topics, mainly related to politics or ideological views. Questions of a political nature are likely to yield higher item nonresponse because of the sensitivity associated with them. While one might think there would be two categories under this dimension, there are three: Apolitical, somewhat political and political. This is to separate the questions that fall into a gray area on this dimension.
Almost half (47%) of the questions we looked at in this analysis are apolitical in nature, 38% are political and 15% are somewhat political.
Coding open-ends into response categories
All three of the above dimensions have mutually exclusive response categories. But some open-ended questions are more difficult to code than others because they don’t fall neatly into one specific category. In many instances, a case could be made for coders to choose two or all three categories, making the decision a subjective one.
To promote reliability in our coding choices, we developed rules that three researchers relied on to code each question. There was agreement among all three coders almost 50% of the time, and among two coders more than 90% of the time. When two coders out of the three agreed on a category, we used the majority code. In the few instances where all three coders disagreed, we conducted a review of the data for the contentious question and/or held a discussion among all three coders to understand the rationale behind each person’s choice and make a final call.
What we found
Generally, it appears item nonresponse rates can range widely across all categories in all three dimensions, depending on whether a readily formed opinion exists and can easily be reported. For example, only 3% of self-identified Democrats or Democratic-leaning respondents declined to answer the following open-ended question: “Thinking about the 2020 presidential election, who would be your choice for the Democratic nomination for president?” In contrast, the item nonresponse rate was 52% — by far the highest in the sample — for the following question: “Are there any other measures that you think would do a lot to reduce inequality between Black people and White people in our country […]?” Even though respondents may have had an opinion on this subject, it is likely that a majority had to think more intentionally about the issue, perhaps for the first time, in order to provide a response.
Below we’ll look at the main takeaways for each of the three dimensions mentioned above.
Requested answer length
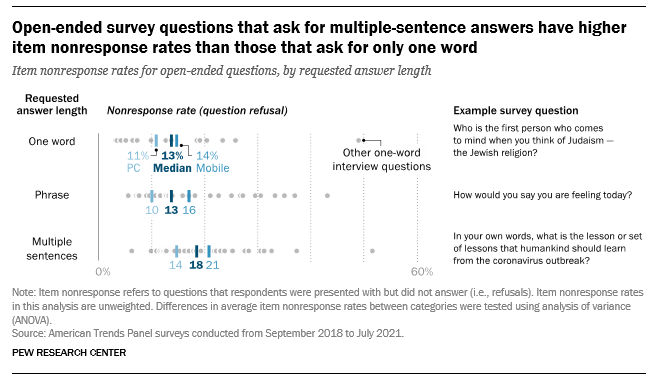
Open-ended questions that solicit multiple sentences generally yield higher item nonresponse rates (18% median) than questions that solicit one word or a phrase (both 13% median). Testing also shows that there are statistically significant differences in the mean item nonresponse rates between the three categories. In particular, item nonresponse rates are significantly lower for questions requesting one-word answers than for questions requesting either a phrase or multiple sentences. There is no reliable difference between average item nonresponse rates of the latter two categories.
The same item nonresponse pattern is observed for respondents using a mobile device to complete a survey. Specifically, item nonresponse rates are significantly lower for questions requesting one-word answers than those soliciting phrases and multiple sentences. However, we do not observe any significant differences in item nonresponse across the three categories when it comes to desktop/PC survey takers.
Cognitive burden
Most questions on the ATP ask respondents to give their perspective on current affairs and pertinent issues or topics. Such questions are often far from trivial, call for intentional thinking and demand more of respondents cognitively, especially when they are posed in open-end fashion. It is no surprise that almost half of the questions in our sample were considered high-burden.
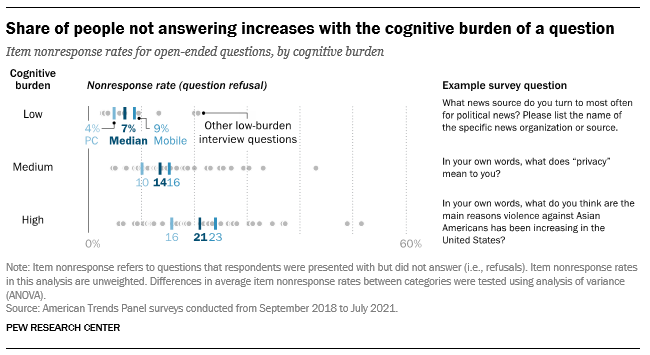
Open-ended item nonresponse rates are positively associated with the cognitive burden of a question. The less response time required to answer a question, the lower the item nonresponse is likely to be, and this relationship is strong. The median item nonresponse rate for medium- and high-burden questions is two times and three times higher, respectively, than for low-burden questions. Testing again reveals that statistically significant differences exist between all three categories. Specifically, item nonresponse rates are significantly lower for low-burden questions than medium-burden questions, and also for medium-burden questions when compared to high-burden questions.
The same relationship holds irrespective of the device used to take the survey. That is, item nonresponse is significantly lower for low-burden questions for both mobile- and desktop-survey takers and increases proportionally with the cognitive burden of a question.
Political focus
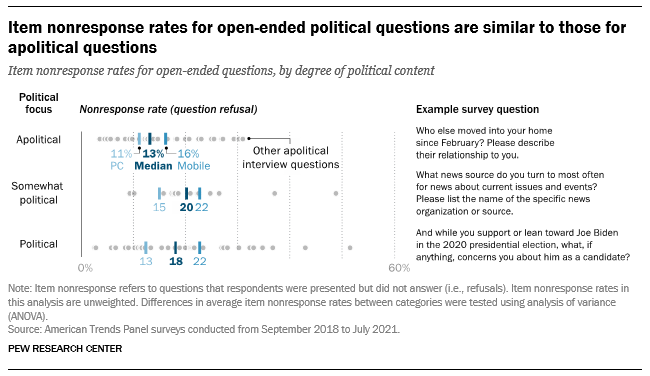
Item nonresponse rates for apolitical open-ended questions are similar to those for politically oriented questions. Unlike the other two dimensions, testing reveals that the differences across categories are not significant. Surprisingly, questions that are only somewhat political seem to elicit slightly higher nonresponse rates, on average, than questions that are overtly political. This suggests some justification for combining the somewhat political and political categories into one. But even doing so, the data reveals no significant difference between apolitical and political questions.
For mobile survey takers, however, political questions solicit significantly higher item nonresponse than apolitical questions. In other words, people who are presented with political questions when taking online surveys on a cellphone or tablet are more likely to refuse those questions than they would questions that are less political in nature. This pattern is not observed for desktop respondents; for them, item nonresponse rates are comparable regardless of the question’s political content.
Conclusion
Many confounding factors are responsible for item nonresponse on open-ended questions. It does not simply fall on the type of question being asked. Respondents’ demographics and interest, the time at which the survey is taken, the device being used, the topic and length of the questionnaire, and the number of questions — open and closed — can all be at play when a question is refused.
Limiting our analysis to three specific question characteristics, we find that the cognitive burden associated with a question has the strongest bearing on item nonresponse, regardless of the device used to take the survey. Low-burden questions also tend to require one-word responses, which elicit significantly lower item nonresponse rates than questions that require longer entries. This is especially true for respondents on mobile devices, such as cellphones and tablets. For desktop users, there is no difference in item nonresponse rates for questions requesting a word, phrase or multiple sentences.
When thinking about questions that would be susceptible to high item nonresponse, we anticipated that those of a politically sensitive nature would fall into that category, but our findings do not fully support that. The only time political questions appear to elicit greater item nonresponse than apolitical questions is when the question is administered on a mobile device. Overall, across all dimensions and categories, item nonresponse is consistently higher on mobile devices than desktop survey administration. This finding corroborates other studies. Finally, testing did not reveal any significant interactions between the dimensions. In other words, categories of requested answer length, cognitive burden and political focus do not work together to influence item nonresponse.
In public opinion polling, it’s sometimes not possible to avoid asking burdensome, open-ended questions. With this analysis, researchers can at least anticipate when the item nonresponse rate to an open-ended question is likely to be high and what specific features of the question might be causing it.


