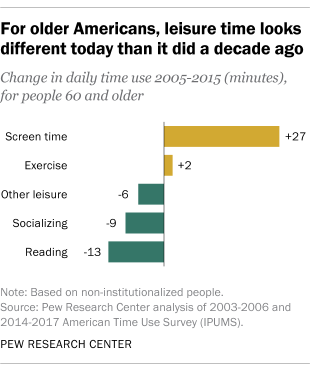
The amount of time that Americans ages 60 and older spend on their TVs, computers, tablets or other electronic devices has risen almost half an hour per day over the past decade, according to a Pew Research Center analysis of Bureau of Labor Statistics data, even as screen time among younger people has more or less held steady.
Those 60 and older – a group increasingly populated by aging Baby Boomers – now spend more than half of their daily leisure time, four hours and 16 minutes, in front of screens, mostly watching TV or videos. Screen time has increased for those in their 60s, 70s, 80s and beyond, and the rise is apparent across genders and education levels. Meanwhile, the time that these older adults spend on other recreational activities, such as reading or socializing, has ticked down slightly.
This rise in screen time coincides with significant growth in the adoption of digital technology by older Americans. In 2000, 14% of those ages 65 and older were internet users; now 73% are. And while smartphone ownership was uncommon at all ages around the turn of the 21st century, now about half (53%) of people 65 and older are smartphone owners.
Overall, leisure time for Americans 60 and older has held steady at about seven hours a day, and the amount of time they spend on other activities has also been quite stable over the past decade. On average, they sleep more than eight and a half hours per day; spend three hours on chores and errands; and devote more than an hour to eating, as well as an additional hour for personal activities such as grooming or health care. By comparison, younger Americans work more, have less leisure and screen time, and spend less time doing housework.
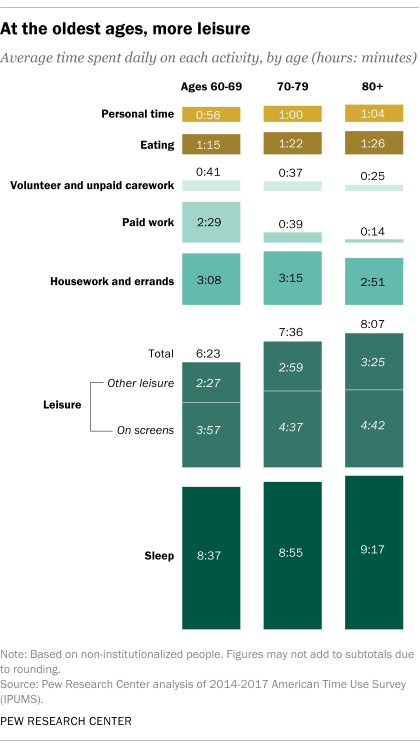
While overall time use patterns of older Americans haven’t changed much over the past decade, some differences do emerge by age, sex and education. More than four-in-ten Americans in their 60s are still working, while just 14% of people in their 70s and 4% of those 80 and older are employed. As a result, the average amount of time spent working per day among people in their 60s is far higher than it is for people ages 70 and older.
These age differences in paid work are also reflected in age differences in time spent on leisure. People in their 60s spend more than an hour less per day, on average, engaged in leisure activities when compared with their older counterparts. Those in their 60s also sleep less than their older counterparts and log a bit more time on unpaid caregiving and volunteering.
The differences in the day-to-day experiences of men and women ages 60 and older largely echo gender patterns that are seen at younger ages. Men 60 and older are more likely to be working than their female counterparts (33% vs. 24%) and, among those who work, they tend to work more hours.
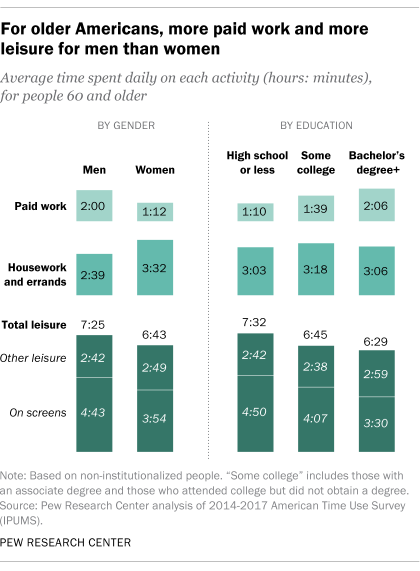
But while more paid work is sometimes linked with less leisure time, this is not the case when it comes to men and women ages 60 and older: Among adults in this age group, men spend 48 more minutes a day working than women, yet they also spend 42 more minutes on leisure time.
For their part, women 60 and older spend almost an hour more per day than men on housework and errands, especially cleaning and food preparation. Women spend an hour and 56 minutes cooking and cleaning daily, compared with 44 minutes for men. On the flip side, men spend more time on household maintenance – 55 minutes a day versus 22 minutes for women.
Time use among older adults also differs by educational attainment. As is the case across age groups, those with higher levels of education are more likely to be employed. Around four-in-ten adults who are 60 and older and have a bachelor’s degree or more (37%) are working, compared with 31% of their counterparts with some college experience and 21% of those with a high school diploma or less. This translates into a gap in the amount of time spent on paid work for all people 60 and older: Those with a bachelor’s degree or more work an average of just over two hours a day, while those with a high school diploma or less work an average of an hour and 10 minutes daily.
As is the case among younger Americans, the additional time spent on paid work by people who are 60 or older and have a bachelor’s degree or more is offset by additional leisure time for people with a high school diploma or less. And not only does the amount of leisure time vary by educational level, so does the way that this leisure time is spent. People with less education spend more of their leisure time on screens and less time reading compared with their more educated counterparts. Less educated adults also spend less time exercising: 12 minutes a day for those with a high school diploma or less, compared with 26 minutes for college graduates.
But the educational gaps in leisure time are not due entirely to differences in time spent working: Even among people 60 and older who are not employed, those with a high school diploma or less spend about half an hour more per day (8 hours and 17 minutes) on leisure than those with either some college (7 hours and 42 minutes) or a bachelor’s degree or more (7 hours and 38 minutes). These differences are driven more by the educational gap in how men spend their leisure time: Men with a high school diploma or less spend an hour more per day on leisure than those with a bachelor’s degree (9 hours and 10 minutes vs. 8 hours and 10 minutes). Among women who are not working, there is a 35-minute educational gap in leisure time (7 hours and 42 minutes vs. 7 hours and 7 minutes).
About the data
This analysis is based primarily on time diary data from the American Time Use Survey (ATUS), which has been sponsored by the Bureau of Labor Statistics and annually conducted by the U.S. Census Bureau since 2003. The ATUS produces a nationally representative sample of non-institutionalized respondents, drawn from the Current Population Survey. The ATUS is not representative of people in nursing homes or other similar institutions, who account for about 3% of the U.S. population ages 60 or older.
The analyses are based on respondents in the 2003-2006 and 2014-2017 ATUS samples (referred to in the text as “2005” and “2015”). For all time points, multiple years of data were combined in order to produce large enough sample sizes to allow for subgroup analysis.
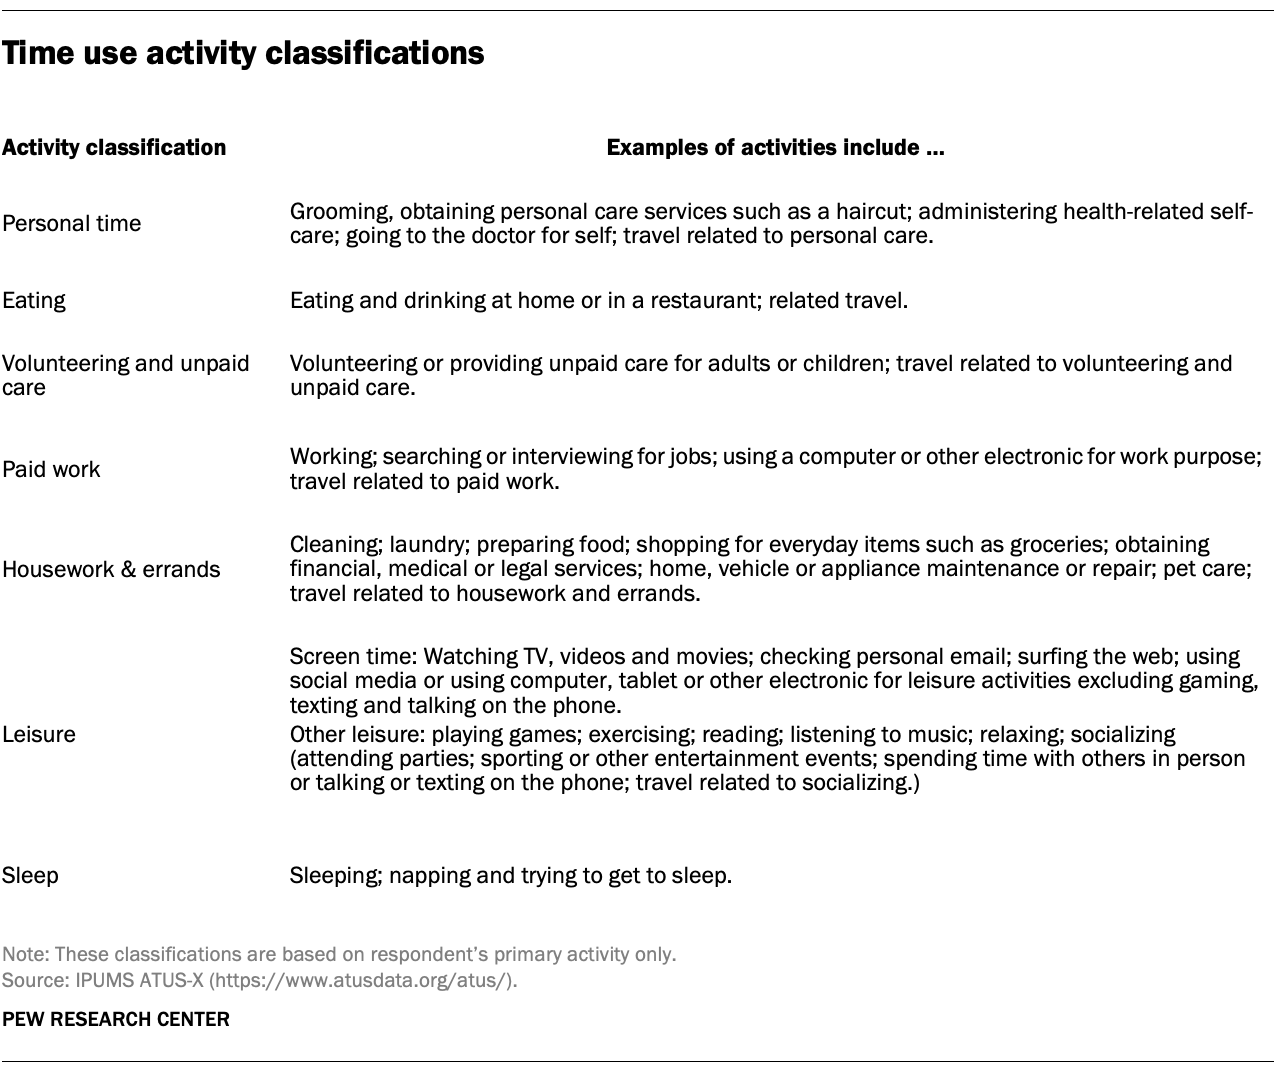
These time diaries track in detail how Americans spend their time, focusing on each respondent’s primary activity (i.e., the main thing they were doing) sequentially for the prior day, including start and end times for each activity.
All data were accessed via the ATUS-X and the IPUMS-ACS website made available through IPUMS.