Pew Knight Initiative
The Pew-Knight Initiative supports new research on how Americans absorb civic information, form beliefs and identities, and engage in their communities.
Pew Research Center is a nonpartisan, nonadvocacy fact tank that informs the public about the issues, attitudes and trends shaping the world. Knight Foundation is a social investor committed to supporting informed and engaged communities. Learn more >
“Religious Radio Across America”
State-level characteristics of religious radio stations
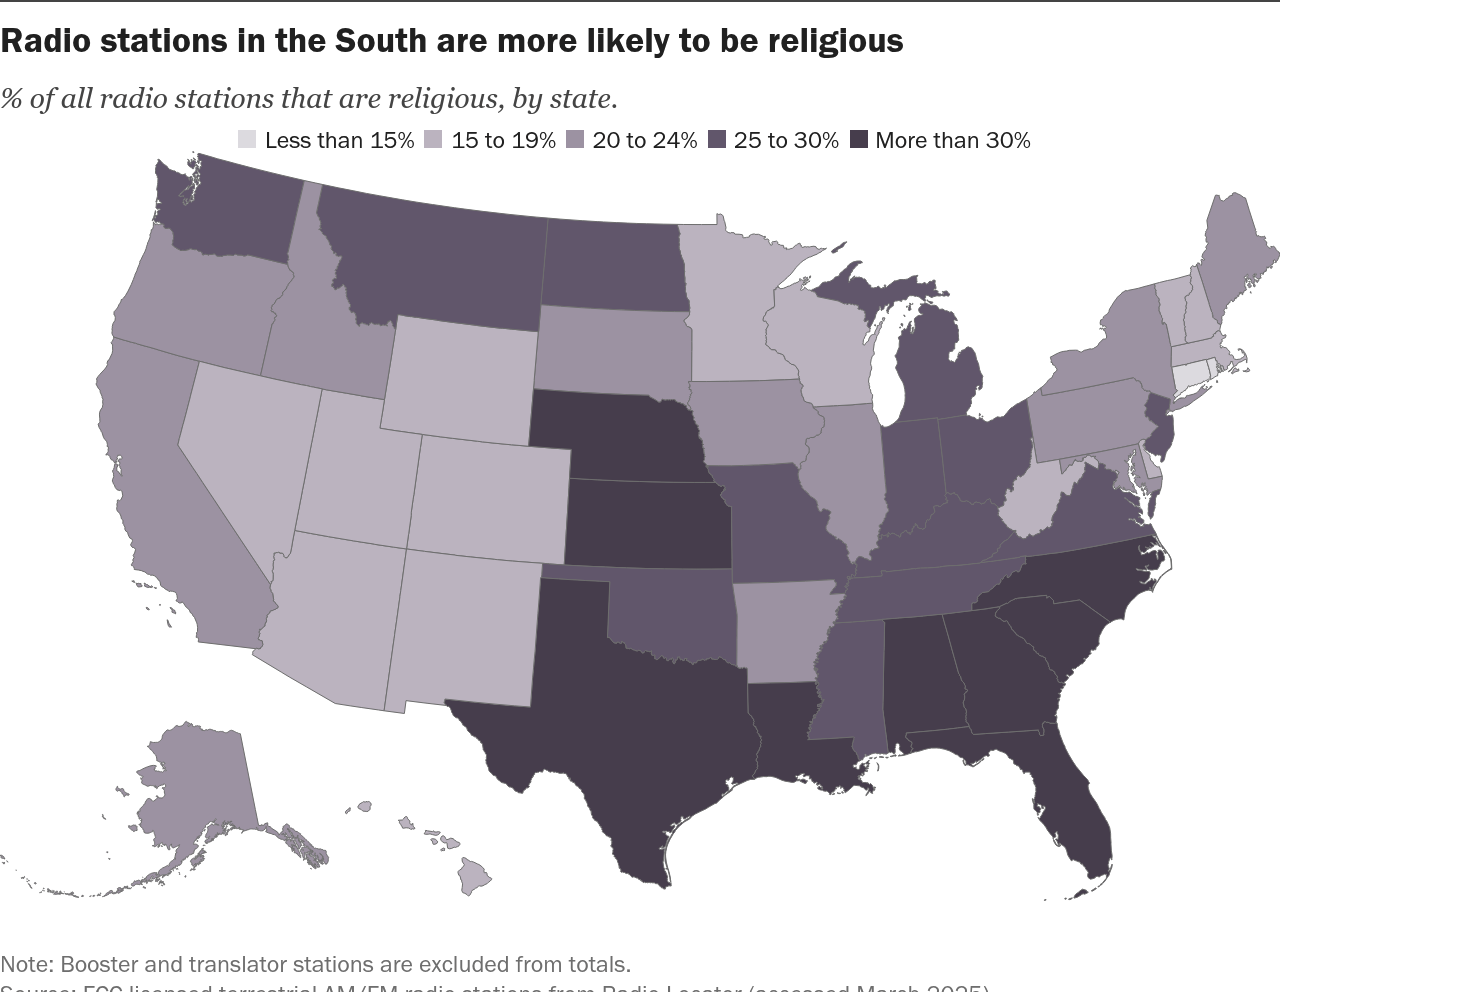
| State | % of all stations that are religious | Number of religious stations | Number of religious stations per 100K residents | % of religious stations that are Catholic | % of religious stations with independent ownership | % of religious stations that play mostly music* | % of religious stations that play mostly talk programming* |
|---|---|---|---|---|---|---|---|
| AK | 23.3% | 54 | 7.3 | 7.0% | 27.8% | 11.5% | 15.4% |
| AL | 30.2% | 113 | 2.2 | 1.1% | 38.9% | 55.4% | 28.6% |
| AR | 23.6% | 79 | 2.5 | 1.6% | 27.0% | 18.2% | 45.5% |
| AZ | 19.3% | 58 | 0.8 | 9.5% | 24.4% | 20.8% | 41.7% |
| CA | 20.4% | 221 | 0.6 | 12.5% | 31.2% | 27.3% | 46.8% |
| CO | 19.2% | 69 | 1.1 | 6.3% | 9.1% | 64.7% | 14.7% |
| CT | 11.9% | 13 | 0.4 | 25.0% | 44.4% | 33.3% | 33.3% |
| DC | 15.0% | 3 | 0.4 | 33.3% | 0.0% | ||
| DE | 16.7% | 6 | 0.6 | 0.0% | 16.7% | 60.0% | 0.0% |
| FL | 30.6% | 227 | 1.0 | 8.5% | 39.2% | 43.0% | 26.0% |
| GA | 31.1% | 161 | 1.4 | 3.6% | 34.0% | 41.5% | 20.0% |
| HI | 16.5% | 20 | 1.4 | 7.7% | 40.0% | 0.0% | 66.7% |
| IA | 22.5% | 72 | 2.2 | 20.8% | 35.7% | 21.9% | 56.3% |
| ID | 23.3% | 44 | 2.2 | 2.9% | 30.8% | 34.6% | 42.3% |
| IL | 22.7% | 117 | 0.9 | 19.6% | 19.1% | 31.0% | 47.9% |
| IN | 27.1% | 108 | 1.5 | 10.7% | 26.4% | 48.2% | 25.0% |
| KS | 30.8% | 92 | 3.1 | 16.9% | 25.3% | 29.1% | 56.4% |
| KY | 26.0% | 102 | 2.2 | 7.8% | 35.0% | 33.3% | 22.2% |
| LA | 31.3% | 100 | 2.2 | 7.8% | 35.1% | 24.4% | 53.7% |
| MA | 15.7% | 37 | 0.5 | 23.1% | 30.0% | 18.8% | 43.8% |
| MD | 20.4% | 30 | 0.5 | 4.3% | 28.6% | 58.8% | 23.5% |
| ME | 20.3% | 30 | 2.1 | 19.2% | 26.7% | 36.8% | 42.1% |
| MI | 26.0% | 135 | 1.3 | 12.3% | 21.1% | 55.9% | 29.0% |
| MN | 16.5% | 67 | 1.1 | 18.0% | 20.3% | 16.1% | 16.1% |
| MO | 27.1% | 116 | 1.8 | 14.1% | 28.1% | 40.8% | 51.3% |
| MS | 29.0% | 85 | 2.9 | 1.5% | 23.5% | 33.3% | 61.5% |
| MT | 26.1% | 68 | 5.9 | 3.4% | 29.4% | 7.0% | 30.2% |
| NC | 35.9% | 182 | 1.6 | 4.8% | 34.7% | 52.2% | 17.8% |
| ND | 25.7% | 35 | 4.4 | 21.4% | 34.3% | 14.3% | 42.9% |
| NE | 32.2% | 76 | 3.8 | 24.6% | 33.8% | 22.2% | 46.3% |
| NH | 15.8% | 18 | 1.3 | 6.3% | 33.3% | 0.0% | 50.0% |
| NJ | 28.4% | 44 | 0.5 | 18.8% | 30.0% | 31.3% | 56.3% |
| NM | 18.5% | 51 | 2.4 | 5.3% | 27.7% | 25.0% | 58.3% |
| NV | 17.1% | 24 | 0.7 | 10.5% | 30.0% | 10.0% | 40.0% |
| NY | 20.8% | 129 | 0.6 | 7.8% | 16.7% | 19.7% | 25.4% |
| OH | 27.3% | 136 | 1.1 | 17.6% | 29.6% | 34.4% | 39.3% |
| OK | 27.4% | 81 | 2.0 | 1.7% | 24.1% | 53.3% | 37.8% |
| OR | 23.1% | 87 | 2.0 | 5.4% | 32.9% | 25.0% | 52.5% |
| PA | 23.7% | 137 | 1.0 | 8.3% | 15.9% | 35.4% | 20.7% |
| RI | 13.3% | 6 | 0.5 | 20.0% | 0.0% | 0.0% | 50.0% |
| SC | 31.8% | 91 | 1.6 | 4.8% | 30.7% | 60.0% | 6.0% |
| SD | 20.3% | 31 | 3.3 | 19.0% | 29.0% | 5.9% | 35.3% |
| TN | 28.6% | 134 | 1.8 | 3.9% | 33.9% | 30.3% | 43.9% |
| TX | 34.1% | 433 | 1.4 | 6.1% | 27.3% | 19.2% | 54.4% |
| UT | 16.1% | 24 | 0.7 | 4.3% | 13.0% | 14.3% | 50.0% |
| VA | 27.6% | 108 | 1.2 | 4.6% | 21.7% | 50.9% | 23.6% |
| VT | 14.7% | 14 | 2.2 | 8.3% | 28.6% | 0.0% | 30.0% |
| WA | 26.5% | 102 | 1.3 | 15.4% | 27.7% | 27.9% | 41.9% |
| WI | 18.7% | 77 | 1.3 | 18.2% | 28.6% | 20.8% | 35.8% |
| WV | 18.9% | 42 | 2.4 | 5.6% | 26.2% | 47.6% | 28.6% |
| WY | 19.3% | 39 | 6.6 | 5.9% | 25.6% | 18.2% | 27.3% |
* Threshold for “mostly music” and “mostly talk programming” is 70% of that programming type. Stations that don’t meet that threshold are categorized as playing a mix of talk and music (not shown). Shares of stations playing mostly music and mostly talk are based on those that broadcast online and were able to be included in content analysis. The stations located in the District of Columbia did not have available web streams and thus are excluded.
Note: Booster and translator stations are excluded from totals. Categorization of station religious tradition is based on the content of station websites.
Source: Radio-Locator (accessed March 2025) and Pew Research Center analysis of 439,711 hours of programming on FCC-licensed terrestrial AM/FM religious radio stations, recorded July 2025.
“Religious Radio Across America”
PEW-KNIGHT INITIATIVE