
Numbers, Facts and Trends Shaping Your World


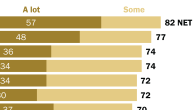
30% of Americans Consult Astrology, Tarot Cards or Fortune Tellers
Most Americans who engage in astrology, tarot cards or fortune-telling say they do it for fun, rather than for insights or guidance on life decisions. Just 6% of Americans say they participate in one or more of these activities at least weekly.


Sign up for our weekly newsletter
Fresh data delivered Saturday mornings
Latest Publications
-
30% of Americans Consult Astrology, Tarot Cards or Fortune Tellers
Most who use astrology (or a horoscope), tarot cards or a fortune teller say they do so just for fun rather than for insights about life.
-
What the data says about Social Security
Most U.S. adults said Social Security benefits shouldn’t be reduced in any way – a view broadly shared across ages, racial and ethnic groups, partisan affiliations and income brackets.
-
How Much Discrimination Do Americans Say Groups Face in the U.S.?
Republicans are less likely than in 2024 to say there is discrimination against Black, Hispanic, Asian and White people.
-
Support for stricter environmental regulations outweighs opposition in a majority of states
Nationally, 60% of Americans say stricter environmental laws and regulations are worth the cost, while 38% say they cost too many jobs and hurt the economy.
-
5 facts about food costs in America
About six-in-ten U.S. adults say food costs are extremely or very important to them when deciding what to buy.


Most Popular

Sign up for The Briefing
Weekly updates on the world of news & information
Politics & Policy

Trump’s Job Rating Drops, Key Policies Draw Majority Disapproval as He Nears 100 Days
Trump’s approval rating stands at 40%, and Americans mostly disapprove of his tariffs and government cuts.


Features


Economy & Work

5 facts about food costs in America
About six-in-ten U.S. adults say food costs are extremely or very important to them when deciding what to buy.

Growing share of U.S. adults say their personal finances will be worse a year from now
About half of Americans (48%) say they have emergency or rainy day funds that would cover their expenses for three months.

How Americans view trade between the U.S. and China, Canada and Mexico
Americans are most skeptical about U.S. trade with China: 10% say it benefits the U.S. more than China, while 46% take the opposite view.

Blue-collar workers are less satisfied at work, less attached to their jobs than other U.S. workers
Among blue-collar workers, 43% say they feel extremely or very satisfied with their jobs; by comparison, 53% of other workers express this level of satisfaction.
Religion

Believing in Spirits and Life After Death Is Common Around the World
Belief in an afterlife, God and spirits in nature is widespread globally. Older adults are more likely than younger adults to believe in God.

Most U.S. Catholics Say They Want the Church To Be ‘More Inclusive’
Majorities want the church to allow use of birth control and IVF, and to permit priests to bless same-sex couples. But views differ by Mass attendance.

10 facts about U.S. Catholics
Catholics are one of the largest religious groups in the United States, outnumbering any single Protestant denomination.

Decline of Christianity in the U.S. Has Slowed, May Have Leveled Off
After years of decline, the U.S. Christian share now shows signs of leveling off. The new Religious Landscape Study explores trends in identity, beliefs and practices.
Internet & Technology

Americans largely foresee AI having negative effects on news, journalists
About six-in-ten Americans (59%) say AI will lead to fewer jobs for journalists in the next two decades.

Teens, Social Media and Mental Health
Parents are more worried than teens about teen mental health. Both groups – especially parents – partly blame social media. But teens also see benefits.

Support dips for U.S. government, tech companies restricting false or violent online content
Democrats and Democratic leaners are more likely than Republicans and Republican leaners to support government restrictions on false information online.

How the U.S. Public and AI Experts View Artificial Intelligence
These groups are far apart in their enthusiasm and predictions for AI, but both want more personal control and worry about too little regulation.

Fewer Americans now support TikTok ban, see the platform as a national security threat than in spring 2023
The share of Americans who perceive TikTok as a national security threat has also dipped – from 59% in 2023 to 49% now.
Our Methods
U.S. Surveys
Pew Research Center has deep roots in U.S. public opinion research. Launched as a project focused primarily on U.S. policy and politics in the early 1990s, the Center has grown over time to study a wide range of topics vital to explaining America to itself and to the world.

International Surveys
Pew Research Center regularly conducts public opinion surveys in countries outside the United States as part of its ongoing exploration of attitudes, values and behaviors around the globe.
Data Science
Pew Research Center’s Data Labs uses computational methods to complement and expand on the Center’s existing research agenda.
Demographic Research
Pew Research Center tracks social, demographic and economic trends, both domestically and internationally.

Our Experts
“A record 23 million Asian Americans trace their roots to more than 20 countries … and the U.S. Asian population is projected to reach 46 million by 2060.”

Neil G. Ruiz,
Head of New Research Initiatives
Methods 101 Videos

Methods 101: Random Sampling
The first video in Pew Research Center’s Methods 101 series helps explain random sampling – a concept that lies at the heart of all probability-based survey research – and why it’s important.


Signature Reports
Decline of Christianity in the U.S. Has Slowed, May Have Leveled Off
America’s News Influencers
Race and LGBTQ Issues in K-12 Schools
Representative Democracy Remains a Popular Ideal, but People Around the World Are Critical of How It’s Working
Americans’ Dismal Views of the Nation’s Politics
Measuring Religion in China
Editor’s Pick

Are children better off when one parent has a job or when both do? U.S. teens differ in their views
Teens, Social Media and Mental Health
What the data says about crime in the U.S.
How Americans view Israel and the Israel-Hamas war at the start of Trump’s second term
What the data says about gun deaths in the U.S.
How Americans view Elon Musk and Mark Zuckerberg

International Affairs
