
The number of refugees admitted to the United States has fallen significantly during President Donald Trump’s second term in office and could hit its lowest level on record this fiscal year, according to a Pew Research Center analysis of U.S. State Department data.

Note: Federal fiscal years begin Oct. 1 and end Sept. 30. The State Department’s refugee counts for fiscal years 2001 through 2019 include Amerasian immigrants, or people born in certain Asian countries to Asian mothers and U.S. citizen fathers who immigrated to the U.S.
| Year | Refugees admitted | Refugee ceiling | % of admissions ceiling | diff | cap |
|---|---|---|---|---|---|
| 2001 | 69,886 | 80,000 | 87 | 10,114 | 800 |
| 2002 | 27,131 | 70,000 | 39 | 42,869 | 800 |
| 2003 | 28,403 | 70,000 | 41 | 41,597 | 800 |
| 2004 | 52,873 | 70,000 | 76 | 17,127 | 800 |
| 2005 | 53,813 | 70,000 | 77 | 16,187 | 800 |
| 2006 | 41,223 | 70,000 | 59 | 28,777 | 800 |
| 2007 | 48,282 | 70,000 | 69 | 21,718 | 800 |
| 2008 | 60,191 | 80,000 | 75 | 19,809 | 800 |
| 2009 | 74,654 | 80,000 | 93 | 5,346 | 800 |
| 2010 | 73,311 | 80,000 | 92 | 6,689 | 800 |
| 2011 | 56,424 | 80,000 | 71 | 23,576 | 800 |
| 2012 | 58,238 | 76,000 | 77 | 17,762 | 800 |
| 2013 | 69,926 | 70,000 | 100 | 74 | 800 |
| 2014 | 69,987 | 70,000 | 100 | 13 | 800 |
| 2015 | 69,933 | 70,000 | 100 | 67 | 800 |
| 2016 | 84,994 | 85,000 | 100 | 6 | 800 |
| 2017 | 53,716 | 110,000 | 49 | 56,284 | 800 |
| 2018 | 22,676 | 45,000 | 50 | 22,324 | 800 |
| 2019 | 30,000 | 30,000 | 100 | 0 | 800 |
| 2020 | 11,814 | 18,000 | 66 | 6,186 | 800 |
| 2021 | 11,411 | 62,500 | 18 | 51,089 | 800 |
| 2022 | 25,465 | 125,000 | 20 | 99,535 | 800 |
| 2023 | 60,014 | 125,000 | 48 | 64,986 | 800 |
| 2024 | 100,034 | 125,000 | 80 | 24,966 | 800 |
| 2025 | 38,102 | 125,000 | 30 | 86,898 | 800 |
| 2026 | 10,258 | 17,500 | 59 | 7,242 | 800 |
Note: Federal fiscal years begin Oct. 1 and end Sept. 30. The State Department’s refugee counts for fiscal years 2001 through 2019 include Amerasian immigrants, or people born in certain Asian countries to Asian mothers and U.S. citizen fathers who immigrated to the U.S.
The federal government has admitted 10,258 refugees through the first 10 months of fiscal year 2026, which ends on Sept. 30. That’s down from 38,102 refugees in fiscal 2025 and 100,034 in fiscal 2024. (President Joe Biden was in office for part of fiscal 2025 and all of fiscal 2024.)
The Trump administration has set an admissions ceiling for this fiscal year at 17,500 refugees, which means it still could take in more than 7,000 before the year is over. But that ceiling is the lowest that the U.S. government has had since at least the turn of the century.
The number of people the government has taken in as refugees has ebbed and flowed with political tides and global conflicts.
President George W. Bush, for instance, temporarily halted refugee application processing after the terrorist attacks of Sept. 11, 2001. During his first term in 2017, Trump temporarily froze refugee resettlements and banned entry by refugees from some Muslim-majority countries. And after Biden took office in 2021, he raised the admissions ceiling for refugees to its highest level so far in the 21st century.
South Africans now account for nearly all refugee admissions
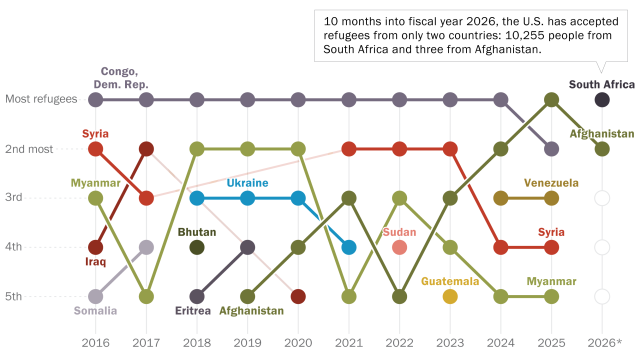
Refugees from South Africa make up almost all the refugees to the U.S. so far in fiscal 2026. Before this fiscal year, South Africans never appeared among the top origin groups. In fact, fiscal 2025 was the first year that the U.S. admitted more than just one or two South African refugees.
The large increase in South African refugees reflects an executive order Trump signed in 2025 that said the federal government would prioritize resettling Afrikaners – an ethnic group descended from mainly Dutch, German and French colonial settlers in South Africa. The executive order said the group faced “government-sponsored race-based discrimination” in South Africa, including the government seizure of farms owned by White South Africans. Those claims have been disputed.
The influx of refugees from South Africa marks a major change in the makeup of refugees to the U.S.
Note: Federal fiscal years begin Oct. 1 and end Sept. 30. The State Department’s refugee counts for fiscal years 2001 through 2019 include Amerasian immigrants, or people born in certain Asian countries to Asian mothers and U.S. citizen fathers who immigrated to the U.S. Myanmar is also called Burma.
| Year | Country | Number from country | Share of all refugees to U.S. | Rank |
|---|---|---|---|---|
| 2016 | Congo, Democratic Republic | 16,370 | 19% | 1 |
| 2016 | Syria | 12,587 | 15% | 2 |
| 2016 | Myanmar | 12,347 | 15% | 3 |
| 2016 | Iraq | 9,880 | 12% | 4 |
| 2016 | Somalia | 9,020 | 11% | 5 |
| 2017 | Congo, Democratic Republic | 9,377 | 17% | 1 |
| 2017 | Iraq | 6,886 | 13% | 2 |
| 2017 | Syria | 6,557 | 12% | 3 |
| 2017 | Somalia | 6,130 | 11% | 4 |
| 2017 | Myanmar | 5,078 | 9% | 5 |
| 2018 | Congo, Democratic Republic | 7,883 | 35% | 1 |
| 2018 | Myanmar | 3,558 | 16% | 2 |
| 2018 | Ukraine | 2,635 | 12% | 3 |
| 2018 | Bhutan | 2,228 | 10% | 4 |
| 2018 | Eritrea | 1,270 | 6% | 5 |
| 2019 | Congo, Democratic Republic | 12,958 | 43% | 1 |
| 2019 | Myanmar | 4,932 | 16% | 2 |
| 2019 | Ukraine | 4,451 | 15% | 3 |
| 2019 | Eritrea | 1,757 | 6% | 4 |
| 2019 | Afghanistan | 1,198 | 4% | 5 |
| 2020 | Congo, Democratic Republic | 2,868 | 24% | 1 |
| 2020 | Myanmar | 2,115 | 18% | 2 |
| 2020 | Ukraine | 1,927 | 16% | 3 |
| 2020 | Afghanistan | 604 | 5% | 4 |
| 2020 | Iraq | 537 | 5% | 5 |
| 2021 | Congo, Democratic Republic | 4,891 | 43% | 1 |
| 2021 | Syria | 1,246 | 11% | 2 |
| 2021 | Afghanistan | 872 | 8% | 3 |
| 2021 | Ukraine | 803 | 7% | 4 |
| 2021 | Myanmar | 772 | 7% | 5 |
| 2022 | Congo, Democratic Republic | 7,810 | 31% | 1 |
| 2022 | Syria | 4,556 | 18% | 2 |
| 2022 | Myanmar | 2,156 | 8% | 3 |
| 2022 | Sudan | 1,669 | 7% | 4 |
| 2022 | Afghanistan | 1,618 | 6% | 5 |
| 2023 | Congo, Democratic Republic | 18,145 | 30% | 1 |
| 2023 | Syria | 10,781 | 18% | 2 |
| 2023 | Afghanistan | 6,594 | 11% | 3 |
| 2023 | Myanmar | 6,185 | 10% | 4 |
| 2023 | Guatemala | 1,748 | 3% | 5 |
| 2024 | Congo, Democratic Republic | 19,923 | 20% | 1 |
| 2024 | Afghanistan | 14,708 | 15% | 2 |
| 2024 | Venezuela | 12,875 | 13% | 3 |
| 2024 | Syria | 11,274 | 11% | 4 |
| 2024 | Myanmar | 7,347 | 7% | 5 |
| 2025 | Afghanistan | 6,758 | 18% | 1 |
| 2025 | Congo, Democratic Republic | 5,672 | 15% | 2 |
| 2025 | Venezuela | 4,559 | 12% | 3 |
| 2025 | Syria | 4,553 | 12% | 4 |
| 2025 | Myanmar | 3,599 | 9% | 5 |
| 2026 | South Africa | 10,255 | 100% | 1 |
| 2026 | Afghanistan | 3 | 0.03% | 2 |
Note: Federal fiscal years begin Oct. 1 and end Sept. 30. The State Department’s refugee counts for fiscal years 2001 through 2019 include Amerasian immigrants, or people born in certain Asian countries to Asian mothers and U.S. citizen fathers who immigrated to the U.S. Myanmar is also called Burma.
People from the Democratic Republic of the Congo made up the largest share of refugees to the U.S. every year from fiscal 2016 through fiscal 2024. The nation has seen ongoing fighting and internal displacement that’s peaked in recent years. So far in fiscal 2026, the federal government has not admitted any refugees from the Democratic Republic of the Congo.
Afghans have also made up a large share of refugees admitted to the U.S. in recent years. They were among the top five origin groups every year between fiscal 2019 – when Afghanistan saw record high civilian casualties and intense fighting between government forces and the Taliban – and fiscal 2025. In fiscal 2025, they accounted for nearly 18% of all refugees admitted to the U.S.
So far in fiscal 2026, the U.S. has admitted just three refugees from Afghanistan.
U.S. now admits fewer refugees than Canada and Australia
The U.S. has been a world leader in resettling refugees since World War II, which launched one of the first global refugee crises in modern times. In recent decades, the U.S. has consistently ranked among the world’s top two countries for resettling refugees.
| Year | U.S. | Canada | Australia |
|---|---|---|---|
| 2010 | 71,355 | 12,085 | 8,516 |
| 2011 | 51,442 | 12,913 | 9,226 |
| 2012 | 66,280 | 9,610 | 5,933 |
| 2013 | 66,245 | 12,160 | 13,169 |
| 2014 | 73,004 | 12,262 | 11,574 |
| 2015 | 66,502 | 19,997 | 9,386 |
| 2016 | 96,858 | 46,691 | 10,586 |
| 2017 | 33,362 | 26,589 | 15,115 |
| 2018 | 22,912 | 28,058 | 12,706 |
| 2019 | 27,501 | 30,082 | 18,240 |
| 2020 | 9,586 | 9,228 | 3,687 |
| 2021 | 13,675 | 20,403 | 3,343 |
| 2022 | 28,945 | 47,550 | 17,325 |
| 2023 | 75,043 | 51,098 | 15,223 |
| 2024 | 105,531 | 49,261 | 17,211 |
| 2025 | 11,513 | 38,771 | 18,804 |
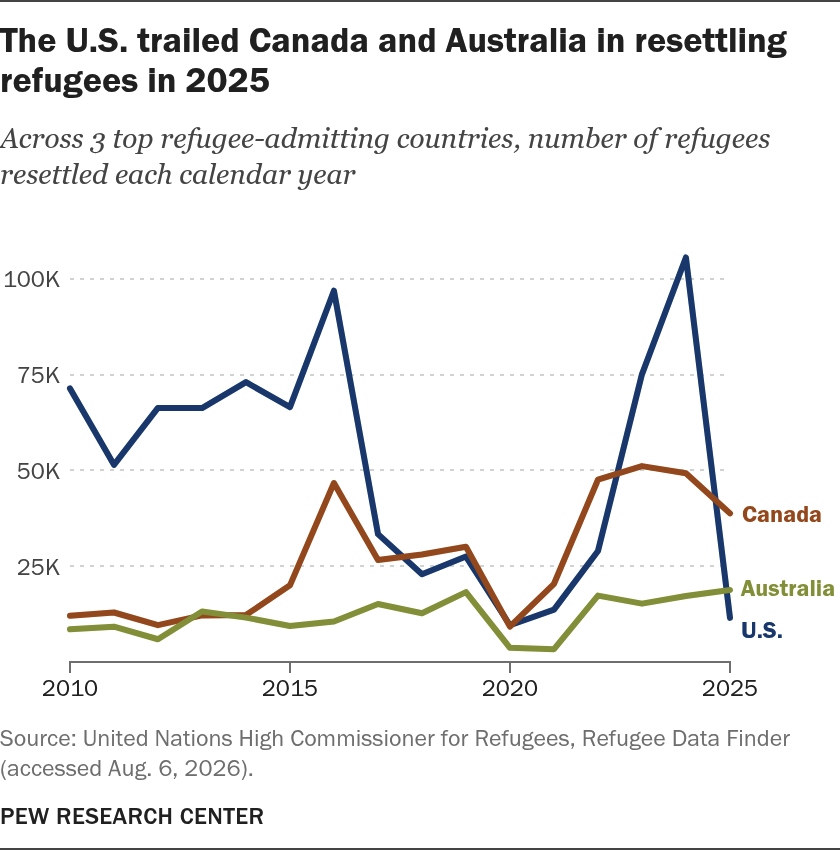
But in 2025, it admitted fewer refugees than both Canada and Australia, according to data from the United Nations High Commissioner for Refugees. Alongside the U.S., Canada and Australia are among the nations that have resettled the most refugees for decades. (The UNHCR data refers to calendar years, not fiscal years. As a result, it is not directly comparable to the State Department data discussed above.)
Canada was the world leader in refugee admissions in 2025, resettling nearly 39,000 refugees, according to UNHCR. Australia resettled nearly 19,000 refugees, followed by the U.S. at about 11,500.
How do Americans feel about admitting refugees?
In recent Pew Research Center surveys, Americans generally have expressed more support than opposition for taking in refugees. In a November 2025 survey, for example, 36% of U.S. adults said it was extremely or very important for the U.S. to “take in refugees from countries where people are trying to escape violence,” while another 39% said this was somewhat important. Around a quarter (24%) said it was not too or not at all important.
But there are partisan divides on this question, with Democrats typically more likely than Republicans to favor admitting refugees.
Public opinion can also vary for different situations and refugee groups. For example, in a 2022 survey conducted after Russia’s invasion of Ukraine, 69% of Americans said they at least somewhat favored admitting thousands of Ukrainian refugees. In a 2021 survey conducted after the U.S. withdrawal from Afghanistan and the Taliban’s takeover, 56% of Americans said they at least somewhat favored admitting thousands of Afghan refugees.
CORRECTION (Aug. 17, 2026): An earlier version of the second graphic in this analysis misstated the number of South African refugees admitted to the U.S. in the 2026 fiscal year. It was 10,255, not 10,258.