
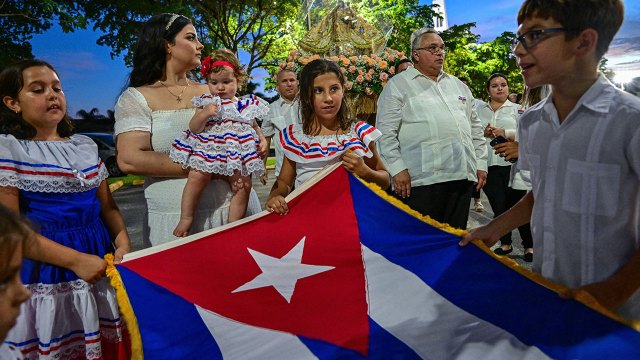
Cubans and Americans have a long history that predates the founding of the United States. Cuba and Florida were both Spanish colonies in the 1500s. Over the last 70 years, political events and economic conditions on the island have led to Cubans coming to the U.S. in waves, including many who arrived following the Cuban Revolution in 1959.
Today, there are millions of people living in the U.S. who trace their origin to Cuba. Here are 10 facts about this population, primarily based on a Pew Research Center analysis of the U.S. Census Bureau’s 2024 American Community Survey.
Cubans are the third-largest Hispanic origin group in the U.S., after Mexicans and Puerto Ricans. As of 2024, there were 2.9 million people of Cuban origin in the U.S. – 23% more than in 2019.
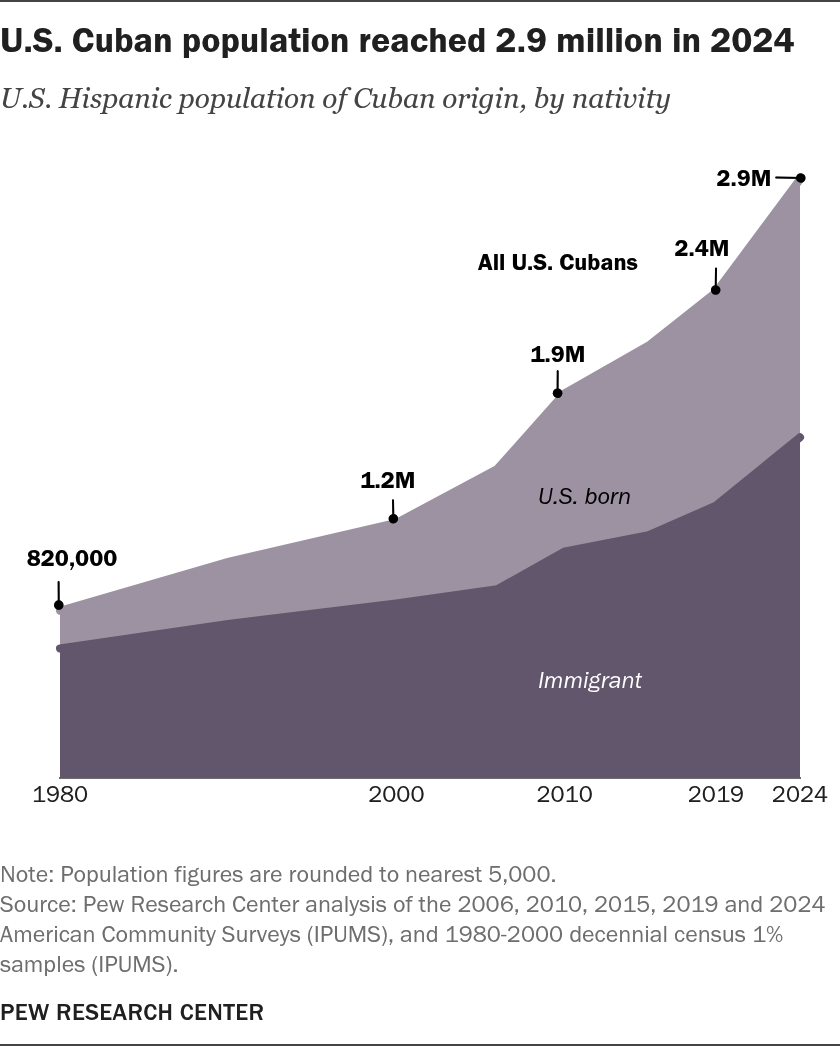
| Year | U.S. born | Immigrant | All U.S. Cubans |
|---|---|---|---|
| 1980 | 185,000 | 635,000 | 820,000 |
| 1990 | 305,000 | 755,000 | 1,060,000 |
| 2000 | 395,000 | 855,000 | 1,250,000 |
| 2006 | 590,000 | 925,000 | 1,515,000 |
| 2010 | 775,000 | 1,110,000 | 1,885,000 |
| 2015 | 930,000 | 1,190,000 | 2,115,000 |
| 2019 | 1,045,000 | 1,335,000 | 2,380,000 |
| 2024 | 1,265,000 | 1,670,000 | 2,935,000 |
That’s faster than the growth rate for Mexicans and Puerto Ricans over the same period (5% each). But it’s slower than the rate for many other Latin American origin groups, including Venezuelans (119%), Colombians (43%) and Hondurans (37%).
More than half of Cubans in the U.S. (57%, or 1.7 million) are immigrants, meaning they were not born in the U.S. The large share of foreign-born Cubans reflects the ongoing arrival of immigrants over the decades, with large numbers coming in recent years.
Immigration from Cuba has ebbed and flowed. A quarter million Cubans arrived in the U.S. in the 1960s following the Cuban Revolution. Another quarter million came in the 1970s.
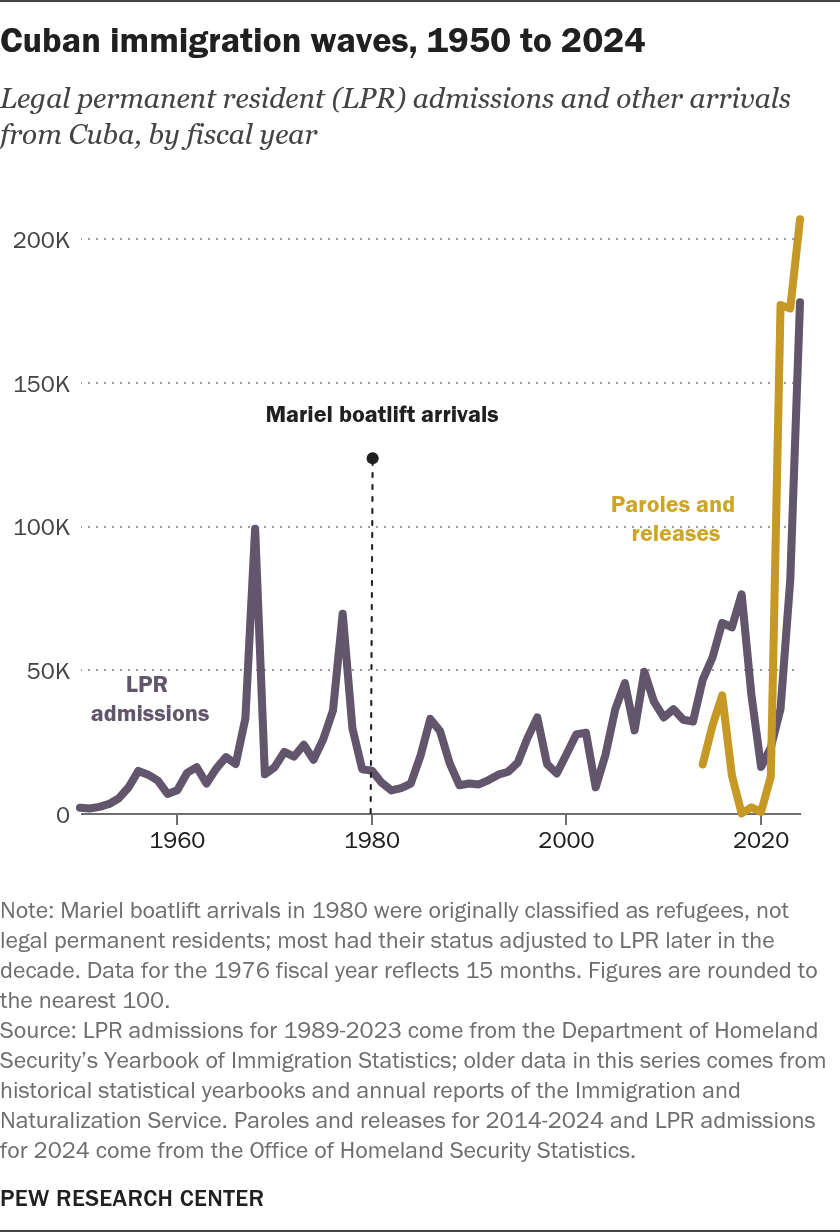
| Year | LPR admissions | Paroles and releases | Mariel boatlift arrivals |
|---|---|---|---|
| 1950 | 2,200 | ||
| 1951 | 1,900 | ||
| 1952 | 2,500 | ||
| 1953 | 3,500 | ||
| 1954 | 5,500 | ||
| 1955 | 9,300 | ||
| 1956 | 15,000 | ||
| 1957 | 13,700 | ||
| 1958 | 11,600 | ||
| 1959 | 7,000 | ||
| 1960 | 8,300 | ||
| 1961 | 14,300 | ||
| 1962 | 16,300 | ||
| 1963 | 10,600 | ||
| 1964 | 15,800 | ||
| 1965 | 19,800 | ||
| 1966 | 17,400 | ||
| 1967 | 33,300 | ||
| 1968 | 99,300 | ||
| 1969 | 13,800 | ||
| 1970 | 16,300 | ||
| 1971 | 21,600 | ||
| 1972 | 20,000 | ||
| 1973 | 24,100 | ||
| 1974 | 18,900 | ||
| 1975 | 26,000 | ||
| 1976 | 36,000 | ||
| 1977 | 69,700 | ||
| 1978 | 29,800 | ||
| 1979 | 15,600 | ||
| 1980 | 15,100 | 125,000 | |
| 1981 | 10,900 | ||
| 1982 | 8,200 | ||
| 1983 | 9,000 | ||
| 1984 | 10,600 | ||
| 1985 | 20,300 | ||
| 1986 | 33,100 | ||
| 1987 | 28,900 | ||
| 1988 | 17,600 | ||
| 1989 | 10,000 | ||
| 1990 | 10,600 | ||
| 1991 | 10,300 | ||
| 1992 | 11,800 | ||
| 1993 | 13,700 | ||
| 1994 | 14,700 | ||
| 1995 | 17,900 | ||
| 1996 | 26,500 | ||
| 1997 | 33,600 | ||
| 1998 | 17,400 | ||
| 1999 | 14,100 | ||
| 2000 | 20,800 | ||
| 2001 | 27,700 | ||
| 2002 | 28,300 | ||
| 2003 | 9,300 | ||
| 2004 | 20,500 | ||
| 2005 | 36,300 | ||
| 2006 | 45,600 | ||
| 2007 | 29,100 | ||
| 2008 | 49,500 | ||
| 2009 | 39,000 | ||
| 2010 | 33,600 | ||
| 2011 | 36,500 | ||
| 2012 | 32,800 | ||
| 2013 | 32,200 | ||
| 2014 | 46,700 | 17,300 | |
| 2015 | 54,400 | 30,700 | |
| 2016 | 66,500 | 41,300 | |
| 2017 | 65,000 | 13,400 | |
| 2018 | 76,500 | 200 | |
| 2019 | 41,600 | 2,300 | |
| 2020 | 16,400 | 700 | |
| 2021 | 23,100 | 13,100 | |
| 2022 | 36,600 | 177,200 | |
| 2023 | 81,600 | 176,000 | |
| 2024 | 178,100 | 207,000 |
Immigration from the island continued into the 1980s and included 125,000 Cubans who came during the monthslong Mariel boatlift, a large exodus in response to political unrest and an economic downturn.
Inflows increased in the mid-2000s and remained high until the COVID-19 pandemic. There was a dramatic increase starting in 2022 as President Joe Biden’s administration changed policies affecting Cuban immigrants.
U.S. immigration policy toward Cubans has changed over the past 70 years. Beginning in the 1960s, almost all Cubans coming to the U.S. were admitted legally – many as refugees. In later years, Cubans entered under the “wet foot, dry foot” policy, which allowed Cubans who reached U.S. soil without visas to remain and pursue legal status. In January 2017, President Barack Obama ended this policy as part of his initiative to establish diplomatic relations with Cuba. Since then, Cubans have generally been subject to policies that also apply to other immigrants.
As a result of policy changes, the number of unauthorized immigrants from Cuba in the U.S. has risen sharply. The nature of U.S. immigration policy toward Cubans meant that there were essentially no unauthorized immigrants from the island in the U.S before 2017. But as of July 2023, there were 475,000 unauthorized Cuban immigrants in the U.S., according to our latest estimates. And at least 250,000 more entered the country between then and the end of 2024.
Under Biden, a majority of unauthorized Cuban immigrants had temporary protection from deportation, including through the CHNV parole program, which allowed immigrants from Cuba, Haiti, Nicaragua and Venezuela to live and work in the U.S.; as well as through special parole and release policies at the southwestern border. In 2025, President Donald Trump’s administration canceled the CHNV program and ended or attempted to end other programs that offered temporary protections from deportations.
Historically, Cubans have been more likely than Hispanics overall to identify as Republican. But their support for the GOP has at times softened.
In an October 2025 Pew Research Center survey, Cuban Americans were more likely than Hispanics overall to say they approve of the Trump administration’s approach to immigration (40% vs. 21%). However, they were about as likely as Hispanics overall to worry that they or someone close to them would get deported (47% vs. 52%).
Florida is home to far more Cubans than any other state. Around six-in-ten Cubans in the U.S. (61%, or 1.8 million) live in Florida. No other Hispanic origin group is as concentrated in a single state.
Another 8% of Cubans live in Texas (225,000). Three other states each account for around 3% of all Cubans in the U.S.: California (99,000), New Jersey (98,000) and New York (85,000).
The Miami metro area has an especially large Cuban population. About four-in-ten Cubans in the U.S. (42%, or 1.2 million) live in and around Miami. Another 177,000 live in the Tampa metro area.
Outside Florida, the next-largest populations of Cubans live in the New York City (153,000) and Houston (107,000) metro areas. In total, 94% of U.S. Cubans live in metro areas, a much higher share than among Americans overall (79%).
Cubans are the oldest Hispanic origin group in the U.S., with a median age of 38.2. That’s identical to the median age of the U.S. population overall, but considerably higher than the median age for all Hispanics (30.2). The higher median age among Cubans is due to older immigrants arriving from the island and the relatively low fertility rate among Cuban Americans in general.

| Group | Less than H.S. diploma | Bachelor’s degree | Graduate degree | Bachelor’s or higher | NETS | Grouping |
|---|---|---|---|---|---|---|
| U.S. population | 10.1 | 22.2 | 14.7 | 36.9 | 37 | Group 1 |
| All Hispanics | 25.9 | 14.3 | 7.3 | 21.6 | 22 | Group 1 |
| Cuban origin | 16.3 | 21.2 | 11.5 | 32.7 | 33 | Group 1 |
| U.S. born | 7.6 | 27.6 | 17.8 | 45.4 | 45 | Group 2 |
| Immigrants | 20.1 | 18.5 | 8.7 | 27.2 | 27 | Group 2 |
Cubans have somewhat less education than Americans overall, but that differs by where they were born. Foreign-born Cubans are less likely than Americans overall to have at least a bachelor’s degree, while the opposite is true for U.S.-born Cubans.
- 11% of Cubans in the U.S. ages 25 and older have a graduate degree (versus 15% of U.S. adults).
- 33% have at least a bachelor’s degree (versus 37%).
- 16% have not graduated from high school (versus 10%).

