
This report is primarily based on a Pew Research Center survey of U.S.-based journalists. The report also draws upon two nationally representative surveys of U.S. adults who are members of the Center’s American Trends Panel. More detail about each of these data sources is provided below.
This is the latest report in Pew Research Center’s ongoing investigation of the state of news, information and journalism in the digital age, a research program funded by The Pew Charitable Trusts, with generous support from the John S. and James L. Knight Foundation.
Survey of journalists
The main source of data for this report is a national survey of 11,889 U.S.-based journalists conducted for Pew Research Center by SSRS. The survey was administered online in English and Spanish from Feb. 16 to March 17, 2022. Estimates for the full sample have a margin of sampling error of plus or minus 1.0 percentage points.
The target population for this study was defined as journalists working in the United States. For this study, journalists are defined as individuals currently working in the news industry who create, edit or report original news stories across a wide range of reporting areas and beats. See Appendix for a detailed profile of the sample across demographics, job title, employment status (e.g., full/part-time employees of a news organization vs. freelance or self-employed), size and type of news organization, and geographic location of their news organization, among other variables.
Sample design
Because there is no readily available list of all U.S. journalists, Center researchers combined multiple data sources to create a broad and diverse sample with the goal of finding and including journalists across as many types of outlets and areas of reporting as possible. The resulting sample was comprised of 167,886 individuals listed in commercial databases of journalists whose job title and media type identified them as likely to be a journalist according to the above definition.
The core of this list of journalists came from a commercial database of journalists maintained by Muck Rack. A second, supplementary commercial database of journalists was used to further improve coverage of U.S. journalists. To ensure that a broad range of journalists were invited to take the survey, researchers cross-referenced the outlets in both of these databases with supplementary lists of media outlets – often lists that have been maintained by academics who track specific segments of the U.S. news industry. Researchers identified the news organizations in these supplementary lists that were not found in either of the databases. A list of these organizations was provided to Muck Rack, which then incorporated information about journalists working at these organizations into its database, provided they met certain criteria such as the organization still being operational and having a web presence.
These supplemental lists of outlets broadened the study’s coverage of journalists in a number of ways, ensuring journalists were included from a variety of different reporting areas, news platform types, as well as outlet sizes and types – from national to hyperlocal newspapers, radio and television stations from the largest to the smallest media markets, ethnic media, nonprofit and independent news outlets, and social media news channels, among a wide range of others.
Next, researchers identified a list of job titles and media outlet types that most closely corresponded to this survey’s target population. The Muck Rack database was searched for records matching each combination of job title and outlet type that were located in the United States. Individuals identified in these searches were included in the sample of journalists. This process was repeated on the second commercial database of journalists, and any additional journalists who had not already been found in Muck Rack were also added to the list.
Finally, records in the list were processed and cleaned to identify and remove any invalid or duplicate records. Altogether, this process identified a total of 167,886 individuals that were potentially eligible to participate in the survey, all of whom were included in the sample.
Screening and eligibility
Because the searches of commercial databases may have returned many individuals who do not qualify as journalists under the study’s definition, at the beginning of the survey, respondents were asked their current job title in the news industry and if they report, edit or create original news stories. Respondents were deemed eligible if they provided their job title and indicated that they report, edit or create original news stories. If respondents said they do not currently work in the news industry; do not report, edit or create original news stories; or refused to answer either screening question, the interview was terminated.
Data collection
Sampled individuals were invited via email to take the survey online. The invitation included links to the survey and FAQs about the study. Because respondents’ preferred language could not be known in advance, the email was written in English but included Spanish language instructions linking to a Spanish translation of the study FAQ. The email also included a link allowing respondents to unsubscribe if they did not wish to participate in the study. Upon clicking the survey link, respondents were given the choice to take the survey in either English or Spanish before proceeding.
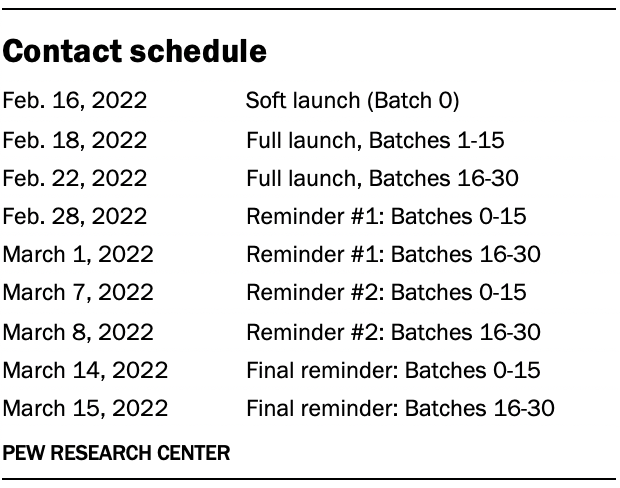
An initial soft launch of 1,000 survey invitations was performed on Feb. 16, 2022, to confirm that all survey systems were working correctly. Because of the large number of email invitations needed for this study, initial invitations for the remainder of the sample were sent in batches on either Feb. 18 or Feb. 22, 2022. (No invitations were sent on the intervening days due to the President’s Day holiday weekend.) A series of three reminder emails were sent approximately one week apart to individuals who had not yet completed the survey, unless they unsubscribed.
No breakout chains or routers were used in the administration of this survey.
Weighting
Unlike general population surveys which can be weighted to align with population parameters from the census and other federal surveys, there are no universally agreed upon benchmarks describing the composition of the population of U.S. journalists. Instead, propensity weighting was used to correct for potential error due to differential nonresponse.
The propensity weights were created to account for two stages of potential nonresponse: 1) completing the screening questions and 2) completion of the full survey among eligible screener respondents.
For the first stage, a random forest model was used to predict the probability that each individual in the sample successfully completed the screening questions. The inverse of these predicted probabilities was used to create an initial screener weight which was trimmed at the 99th percentile to reduce the loss in precision stemming from variance in the weights.
For the second stage, another random forest model was used to predict the probability of completing the full survey among journalists were determined to be eligible in the screener. For the second stage model, cases were weighted according to their first-stage screener weight.
For respondents who completed the entire survey, the final weight was created by dividing their first-stage screener weight by their predicted probability of completing the full survey. This weight was also trimmed at the 99th percentile.
Both the first and second stage models used the same predictor variables that were available for every individual in the sample. Specifically, the following variables were created for each sampled individual:
- Job title grouping
- Media outlet type grouping
- Freelance journalist (yes/no)
- Major metropolitan areas (New York, Washington, D.C., Los Angeles, Chicago, Boston, San Francisco, Atlanta, Other location)
Sampling errors and tests of statistical significance take into account the effect of weighting. The following table shows the unweighted sample sizes and the error attributable to sampling that would be expected at the 95% level of confidence for different groups in the survey.
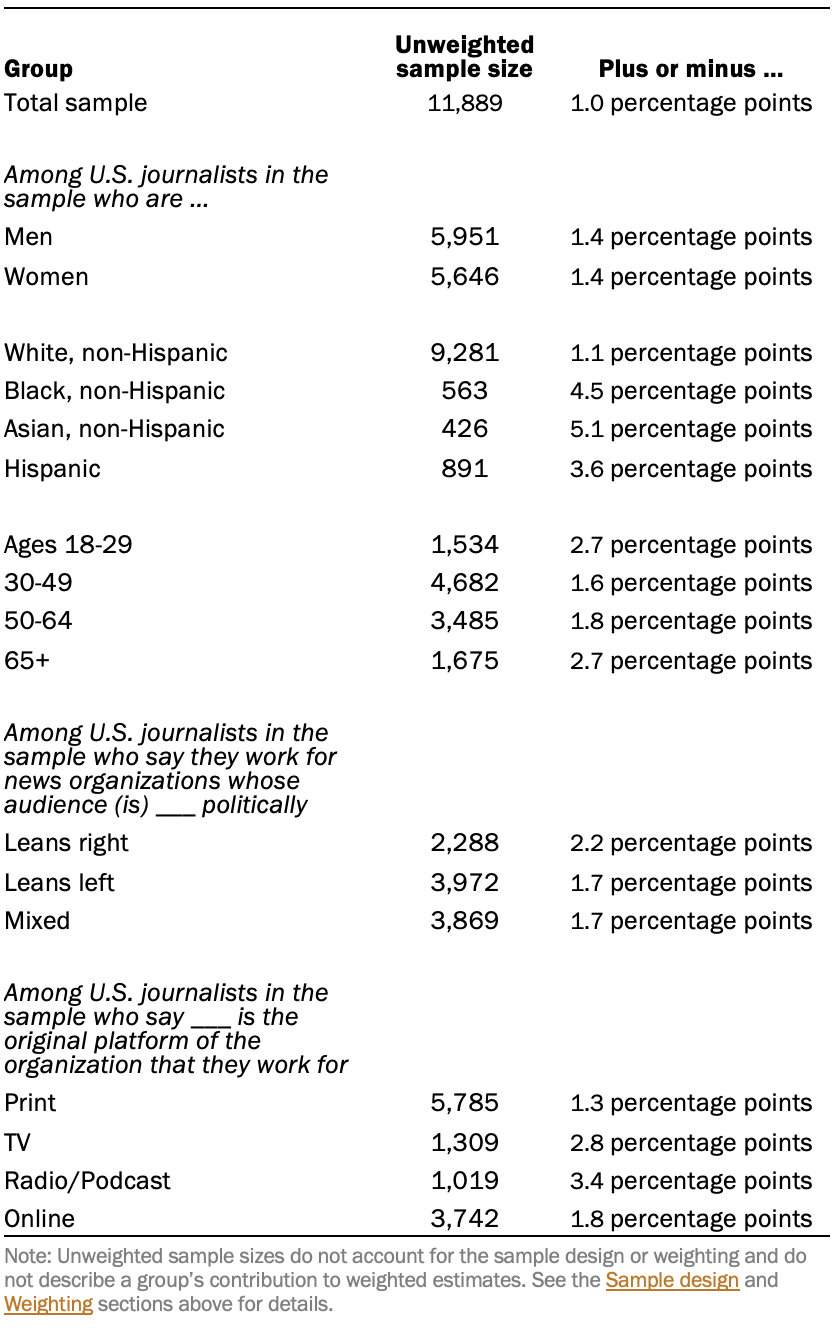
Sample sizes and sampling errors for other subgroups are available upon request. In addition to sampling error, one should bear in mind that question wording and practical difficulties in conducting surveys can introduce error or bias into the findings of opinion polls.
Advisory board
In addition to a team of subject area and methodological experts at the Pew Research Center, the project was also guided by an advisory board of five members. This board included both practitioners of journalism and scholars of journalism and related areas. Advisers provided feedback at various key points during the project, include on the sample design, the questionnaire, and a draft of the report.
Open-ended questions asked in the survey of journalists
One word to describe the news industry
In the questionnaire, journalists were asked in two open-ended questions to write in 1) the one word they would use to describe the news industry these days, and 2) the one word they think the public would use to describe the news industry these days. This allowed respondents to name any possible word that comes to mind. If respondents volunteered more than one concept, only the first one was accepted.
Researchers grouped these responses into categories of like words. For instance, a category for “struggling and chaos” was created that includes a number of other related words such as “dying,” “declining” and “under-resourced.” Additionally, each category was then determined to be a “negative,” “positive” or “neutral” word.
All categories that appeared among 2.0% or more of respondents are reported in the topline. All other categories that did not reach the 2.0% threshold were combined into one of the “other” categories based on the valance of the category.
One thing the news industry does the best and worst job at
Journalists were asked in a pair of open-ended questions to write down the one thing that the news industry does the best job of these days and what it does worst. This allowed respondents to provide any possible answer that came to mind. If more than one answer was provided in their response, only the first answer was accepted.
Researchers categorized each of the responses into one of nine broad categories, in addition to an “other” category for responses that did not belong in one of the nine categories and a response for those who did not know or did not provide a response. Responses to these two open-ended questions can be found in the topline.
February survey of U.S. adults: American Trends Panel survey methodology
Overview
The American Trends Panel (ATP), created by Pew Research Center, is a nationally representative panel of randomly selected U.S. adults. Panelists participate via self-administered web surveys. Panelists who do not have internet access at home are provided with a tablet and wireless internet connection. Interviews are conducted in both English and Spanish. The panel is being managed by Ipsos.
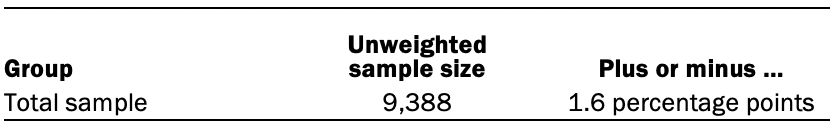
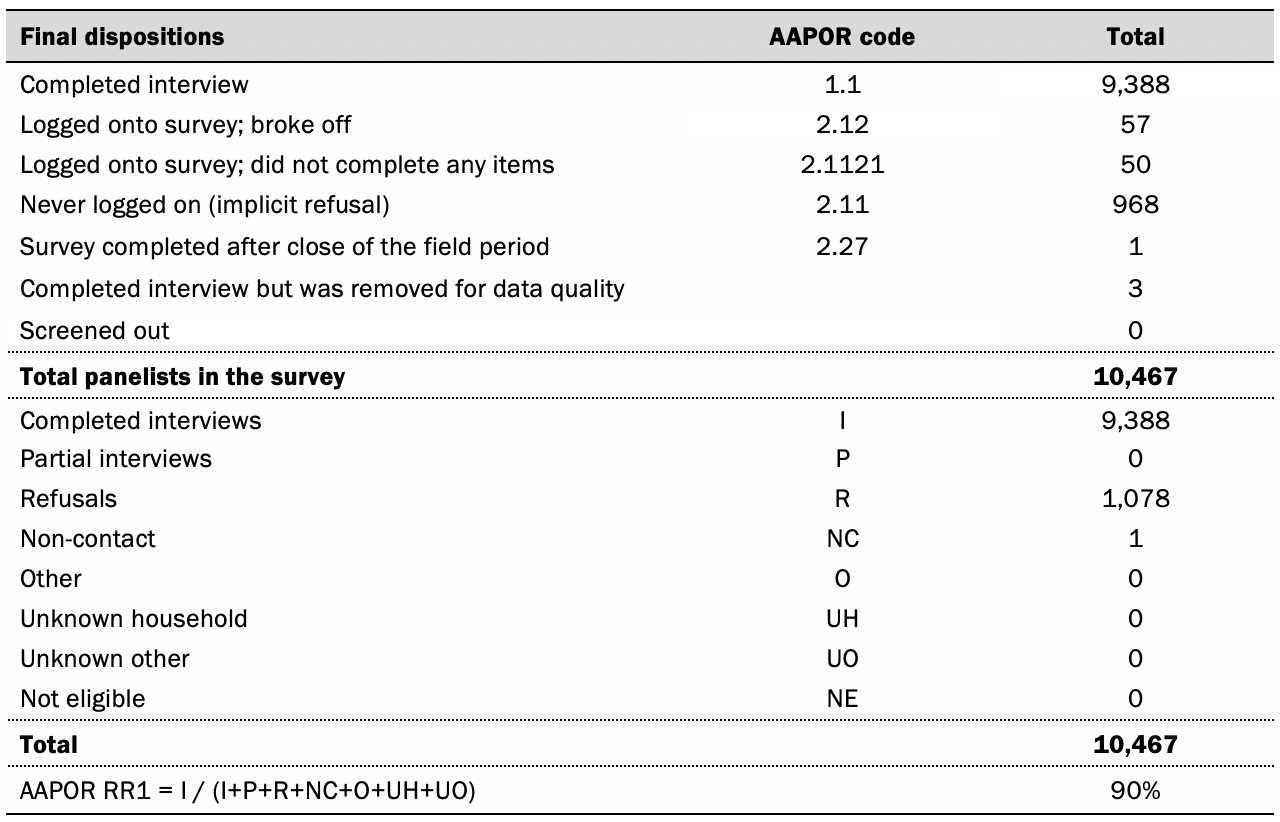
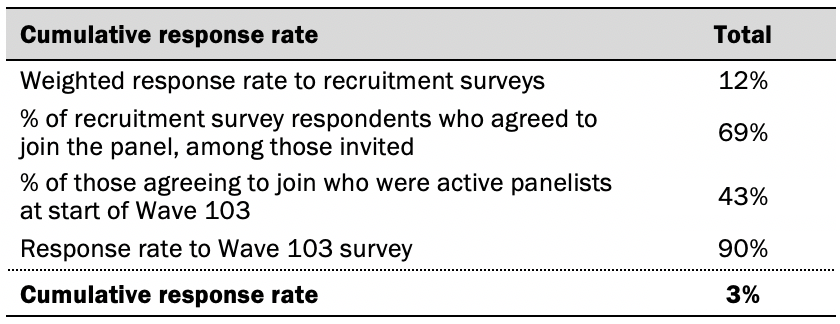
Data in this report is drawn from the panel wave conducted from Feb. 7 to Feb. 13, 2022. A total of 9,388 panelists responded out of 10,467 who were sampled, for a response rate of 90%. The cumulative response rate accounting for nonresponse to the recruitment surveys and attrition is 3%. The break-off rate among panelists who logged on to the survey and completed at least one item is 1%. The margin of sampling error for the full sample of 9,388 respondents is plus or minus 1.6 percentage points.
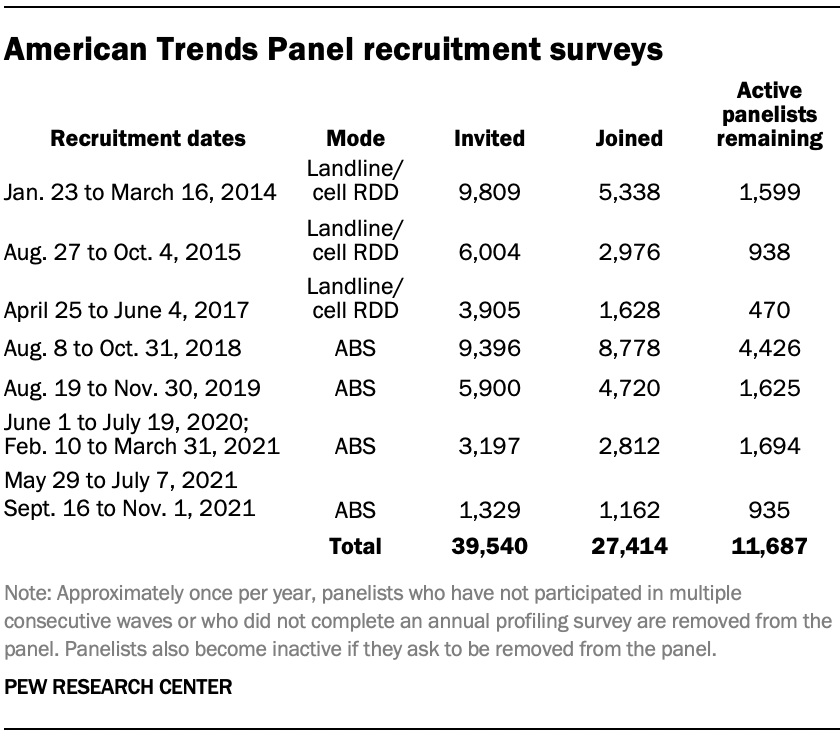
Panel recruitment

The ATP was created in 2014, with the first cohort of panelists invited to join the panel at the end of a large, national, landline and cellphone random-digit-dial survey that was conducted in both English and Spanish. Two additional recruitments were conducted using the same method in 2015 and 2017, respectively. Across these three surveys, a total of 19,718 adults were invited to join the ATP, of whom 9,942 (50%) agreed to participate.
In August 2018, the ATP switched from telephone to address-based recruitment. Invitations were sent to a stratified, random sample of households selected from the U.S. Postal Service’s Delivery Sequence File. Sampled households receive mailings asking a randomly selected adult to complete a survey online. A question at the end of the survey asks if the respondent is willing to join the ATP. Starting in 2020 another stage was added to the recruitment. Households that do not respond to the online survey are sent a paper version of the questionnaire, $5 and a postage-paid return envelope. A subset of the adults returning the paper version of the survey are invited to join the ATP. This subset of adults receive a follow-up mailing with a $10 pre-incentive and invitation to join the ATP.
Across the four address-based recruitments, a total of 19,822 adults were invited to join the ATP, of whom 17,472 agreed to join the panel and completed an initial profile survey. In each household, the adult with the next birthday was asked to go online to complete a survey, at the end of which they were invited to join the panel. Of the 27,414 individuals who have ever joined the ATP, 11,691 remained active panelists and continued to receive survey invitations at the time this survey was conducted.
The U.S. Postal Service’s Delivery Sequence File has been estimated to cover as much as 98% of the population, although some studies suggest that the coverage could be in the low 90% range.1 The American Trends Panel never uses breakout routers or chains that direct respondents to additional surveys.
Sample design
The overall target population for this survey was non-institutionalized persons ages 18 and older, living in the U.S., including Alaska and Hawaii.
Questionnaire development and testing
The questionnaire was developed by Pew Research Center in consultation with Ipsos. The web program was rigorously tested on both PC and mobile devices by the Ipsos project management team and Pew Research Center researchers. The Ipsos project management team also populated test data that was analyzed in SPSS to ensure the logic and randomizations were working as intended before launching the survey.
Incentives
All respondents were offered a post-paid incentive for their participation. Respondents could choose to receive the post-paid incentive in the form of a check or a gift code to Amazon.com or could choose to decline the incentive. Incentive amounts ranged from $5 to $15 depending on whether the respondent belongs to a part of the population that is harder or easier to reach. Differential incentive amounts were designed to increase panel survey participation among groups that traditionally have low survey response propensities.
Data collection protocol
The data collection field period for this survey was Feb. 7 to Feb. 13, 2022. Postcard notifications were mailed to all ATP panelists with a known residential address on Feb. 7.
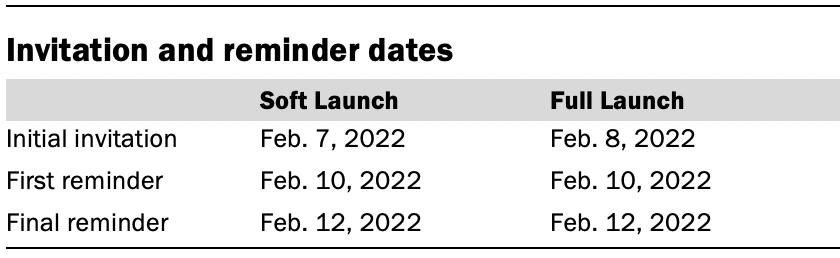
Invitations were sent out in two separate launches: Soft Launch and Full Launch. Sixty panelists were included in the soft launch, which began with an initial invitation sent on Feb. 7, 2022. The ATP panelists chosen for the initial soft launch were known responders who had completed previous ATP surveys within one day of receiving their invitation. All remaining English- and Spanish-speaking panelists were included in the full launch and were sent an invitation on Feb. 8.
All panelists with an email address received an email invitation and up to two email reminders if they did not respond to the survey. All ATP panelists that consented to SMS messages received an SMS invitation and up to two SMS reminders.
Data quality checks
To ensure high-quality data, the Center’s researchers performed data quality checks to identify any respondents showing clear patterns of satisficing. This includes checking for very high rates of leaving questions blank, as well as always selecting the first or last answer presented. As a result of this checking, three ATP respondents were removed from the survey dataset prior to weighting and analysis.
Weighting
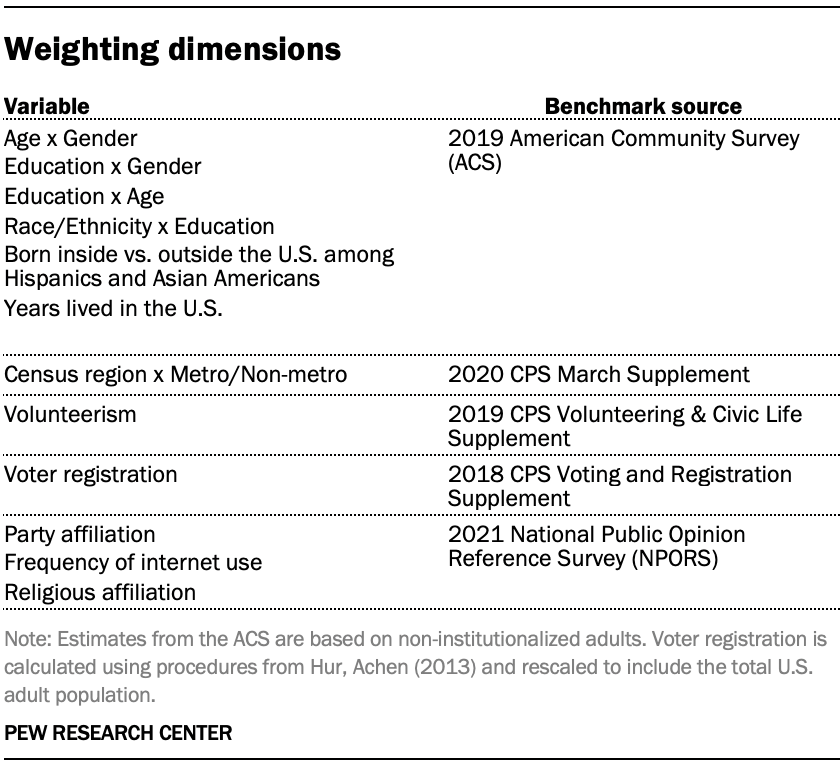
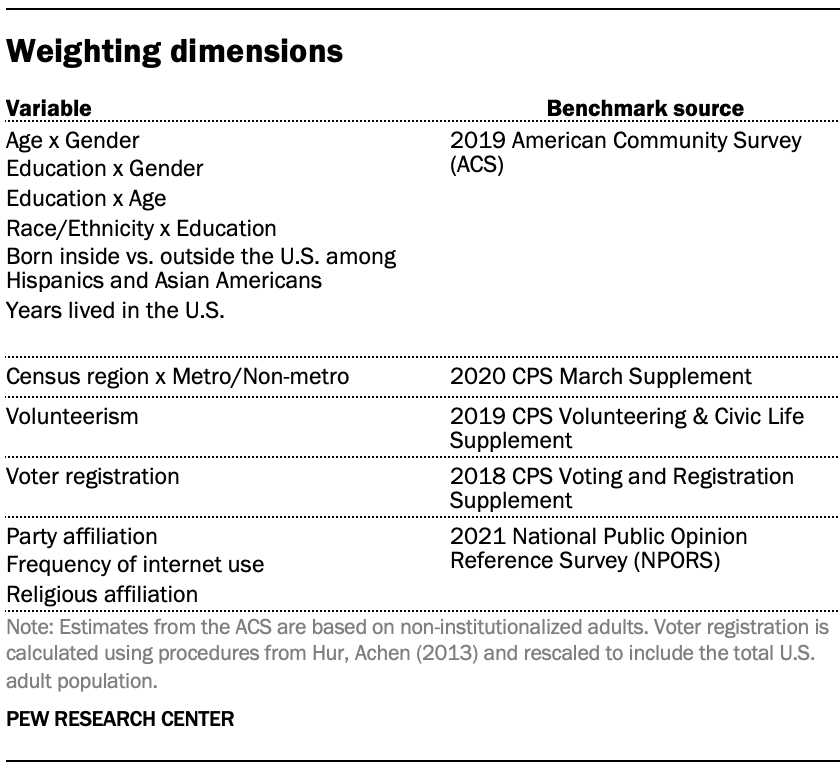
The ATP data is weighted in a multistep process that accounts for multiple stages of sampling and nonresponse that occur at different points in the survey process. First, each panelist begins with a base weight that reflects their probability of selection for their initial recruitment survey. The base weights for panelists recruited in different years are scaled to be proportionate to the effective sample size for all active panelists in their cohort and then calibrated to align with the population benchmarks in the accompanying table to correct for nonresponse to recruitment surveys and panel attrition. If only a subsample of panelists was invited to participate in the wave, this weight is adjusted to account for any differential probabilities of selection.
Among the panelists who completed the survey, this weight is then calibrated again to align with the population benchmarks identified in the accompanying table and trimmed at the 1st and 99th percentiles to reduce the loss in precision stemming from variance in the weights. Sampling errors and tests of statistical significance take into account the effect of weighting.
Some of the population benchmarks used for weighting come from surveys conducted prior to the coronavirus outbreak that began in February 2020. However, the weighting variables for panelists recruited in 2021 were measured at the time they were recruited to the panel. Likewise, the profile variables for existing panelists were updated from panel surveys conducted in July or August 2021.
This does not pose a problem for most of the variables used in the weighting, which are quite stable at both the population and individual levels. However, volunteerism may have changed over the intervening period in ways that made their 2021 measurements incompatible with the available (pre-pandemic) benchmarks. To address this, volunteerism is weighted using the profile variables that were measured in 2020. For all other weighting dimensions, the more recent panelist measurements from 2021 are used.
For panelists recruited in 2021, plausible values were imputed using the 2020 volunteerism values from existing panelists with similar characteristics. This ensures that any patterns of change that were observed in the existing panelists were also reflected in the new recruits when the weighting was performed.
The following table shows the unweighted sample sizes and the error attributable to sampling that would be expected at the 95% level of confidence for different groups in the survey.
Sample sizes and sampling errors for other subgroups are available upon request. In addition to sampling error, one should bear in mind that question wording and practical difficulties in conducting surveys can introduce error or bias into the findings of opinion polls.
March survey of U.S. adults: American Trends Panel survey methodology
Overview
The American Trends Panel (ATP), created by Pew Research Center, is a nationally representative panel of randomly selected U.S. adults. Panelists participate via self-administered web surveys. Panelists who do not have internet access at home are provided with a tablet and wireless internet connection. Interviews are conducted in both English and Spanish. The panel is being managed by Ipsos.
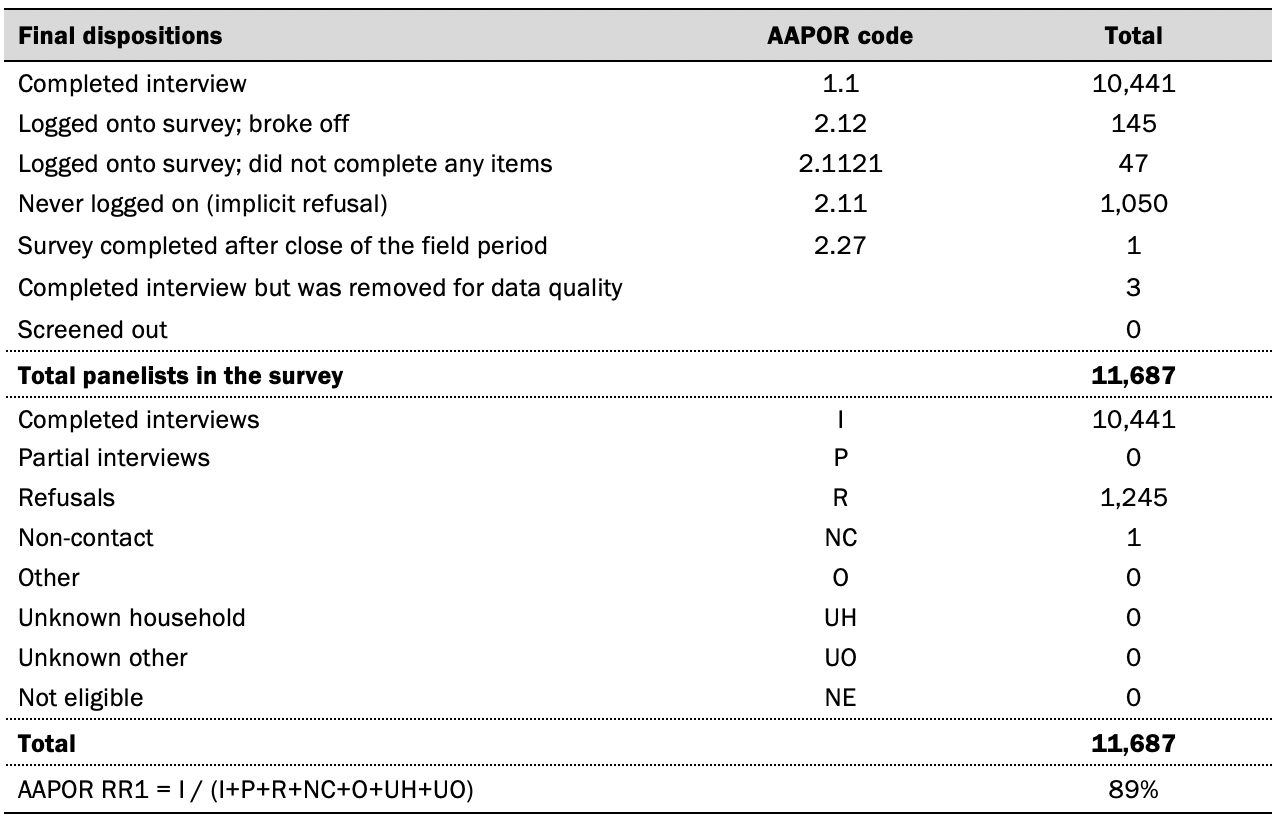
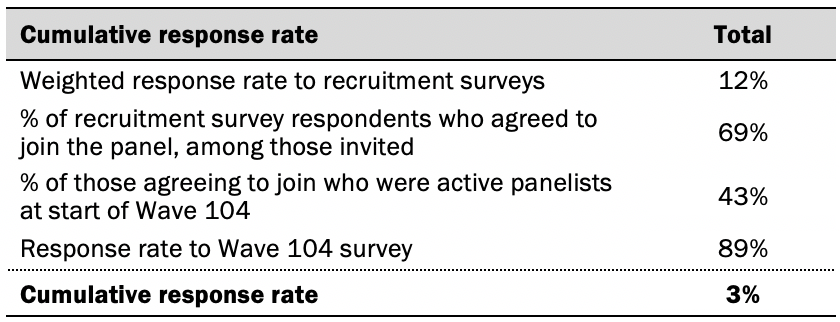
Data in this report is drawn from the panel wave conducted from March 7 to March 13, 2022. A total of 10,441 panelists responded out of 11,687 who were sampled, for a response rate of 89%. The cumulative response rate accounting for nonresponse to the recruitment surveys and attrition is 3%. The break-off rate among panelists who logged on to the survey and completed at least one item is 1%. The margin of sampling error for the full sample of 10,441 respondents is plus or minus 1.5 percentage points.
Panel recruitment
The ATP was created in 2014, with the first cohort of panelists invited to join the panel at the end of a large, national, landline and cellphone random-digit-dial survey that was conducted in both English and Spanish. Two additional recruitments were conducted using the same method in 2015 and 2017, respectively. Across these three surveys, a total of 19,718 adults were invited to join the ATP, of whom 9,942 (50%) agreed to participate.
In August 2018, the ATP switched from telephone to address-based recruitment. Invitations were sent to a stratified, random sample of households selected from the U.S. Postal Service’s Delivery Sequence File. Sampled households receive mailings asking a randomly selected adult to complete a survey
online. A question at the end of the survey asks if the respondent is willing to join the ATP. Starting in 2020 another stage was added to the recruitment. Households that do not respond to the online survey are sent a paper version of the questionnaire, $5 and a postage-paid return envelope. A subset of the adults returning the paper version of the survey are invited to join the ATP. This subset of adults receive a follow-up mailing with a $10 pre-incentive and invitation to join the ATP.
Across the four address-based recruitments, a total of 19,822 adults were invited to join the ATP, of whom 17,472 agreed to join the panel and completed an initial profile survey. In each household, the adult with the next birthday was asked to go online to complete a survey, at the end of which they were invited to join the panel. Of the 27,414 individuals who have ever joined the ATP, 11,687 remained active panelists and continued to receive survey invitations at the time this survey was conducted.
The U.S. Postal Service’s Delivery Sequence File has been estimated to cover as much as 98% of the population, although some studies suggest that the coverage could be in the low 90% range.2 The American Trends Panel never uses breakout routers or chains that direct respondents to additional surveys.
Sample design
The overall target population for this survey was non-institutionalized persons ages 18 and older, living in the U.S., including Alaska and Hawaii.
Questionnaire development and testing
The questionnaire was developed by Pew Research Center in consultation with Ipsos. The web program was rigorously tested on both PC and mobile devices by the Ipsos project management team and Pew Research Center researchers. The Ipsos project management team also populated test data that was analyzed in SPSS to ensure the logic and randomizations were working as intended before launching the survey.
Incentives
All respondents were offered a post-paid incentive for their participation. Respondents could choose to receive the post-paid incentive in the form of a check or a gift code to Amazon.com or could choose to decline the incentive. Incentive amounts ranged from $5 to $20 depending on whether the respondent belongs to a part of the population that is harder or easier to reach.
Differential incentive amounts were designed to increase panel survey participation among groups that traditionally have low survey response propensities.
Data collection protocol
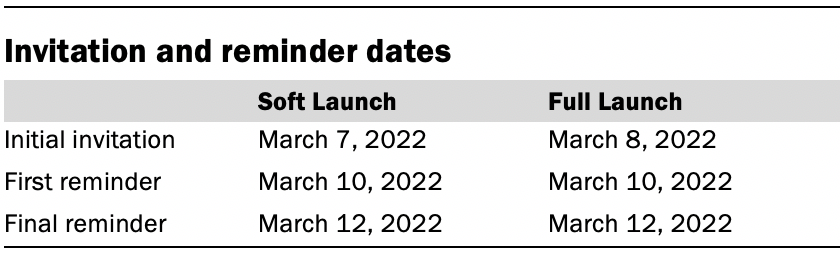
The data collection field period for this survey was March 7 to March 13, 2022. Postcard notifications were mailed to all ATP panelists with a known residential address on March 7.
Invitations were sent out in two separate launches: Soft Launch and Full Launch. Sixty panelists were included in the soft launch, which began with an initial invitation sent on March 7. The ATP panelists chosen for the initial soft launch were known responders who had completed previous ATP surveys within one day of receiving their invitation. All remaining English- and Spanish-speaking panelists were included in the full launch and were sent an invitation on March 8.
All panelists with an email address received an email invitation and up to two email reminders if they did not respond to the survey. All ATP panelists that consented to SMS messages received an SMS invitation and up to two SMS reminders.
Data quality checks
To ensure high-quality data, the Center’s researchers performed data quality checks to identify any respondents showing clear patterns of satisficing. This includes checking for very high rates of leaving questions blank, as well as always selecting the first or last answer presented. As a result of this checking, three ATP respondents were removed from the survey dataset prior to weighting and analysis.
Weighting
The ATP data is weighted in a multistep process that accounts for multiple stages of sampling and nonresponse that occur at different points in the survey process. First, each panelist begins with a base weight that reflects their probability of selection for their initial recruitment survey. The base weights for panelists recruited in different years are scaled to be proportionate to the effective sample size for all active panelists in their cohort and then calibrated to align with the population benchmarks in the accompanying table to correct for nonresponse to recruitment surveys and panel attrition. If only a subsample of panelists was invited to participate in the wave, this weight is adjusted to account for any differential probabilities of selection.
Among the panelists who completed the survey, this weight is then calibrated again to align with the population benchmarks identified in the accompanying table and trimmed at the 1st and 99th percentiles to reduce the loss in precision stemming from variance in the weights. Sampling errors and tests of statistical significance take into account the effect of weighting.
Some of the population benchmarks used for weighting come from surveys conducted prior to the coronavirus outbreak that began in February 2020. However, the weighting variables for panelists recruited in 2021 were measured at the time they were recruited to the panel. Likewise, the profile variables for existing panelists were updated from panel surveys conducted in July or August 2021.
This does not pose a problem for most of the variables used in the weighting, which are quite stable at both the population and individual levels. However, volunteerism may have changed over the intervening period in ways that made their 2021 measurements incompatible with the available (pre-pandemic) benchmarks. To address this, volunteerism is weighted using the profile variables that were measured in 2020. For all other weighting dimensions, the more recent panelist measurements from 2021 are used.
For panelists recruited in 2021, plausible values were imputed using the 2020 volunteerism values from existing panelists with similar characteristics. This ensures that any patterns of change that were observed in the existing panelists were also reflected in the new recruits when the weighting was performed.
The following table shows the unweighted sample sizes and the error attributable to sampling that would be expected at the 95% level of confidence for different groups in the survey.

Sample sizes and sampling errors for other subgroups are available upon request. In addition to sampling error, one should bear in mind that question wording and practical difficulties in conducting surveys can introduce error or bias into the findings of opinion polls.
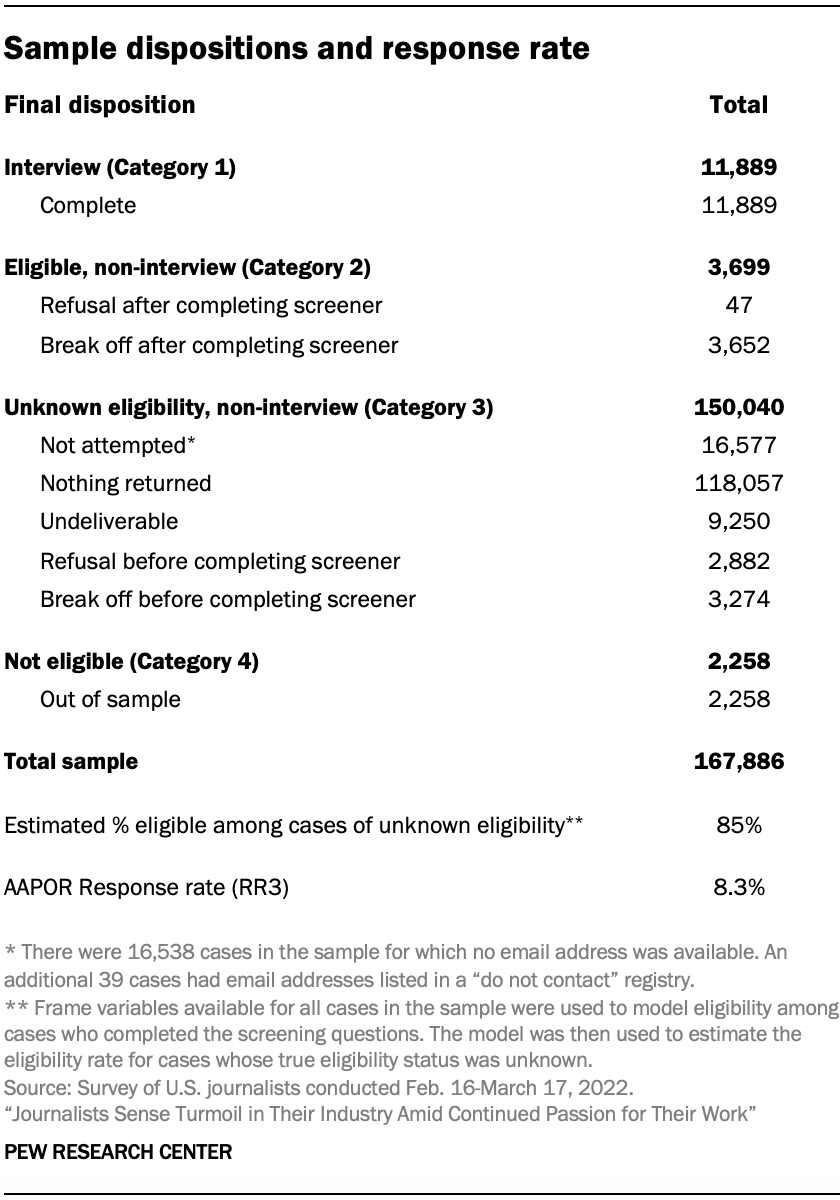
Dispositions and response rates
© Pew Research Center, 2022


