
Young adults today are coming of age in a different economic and social landscape than their parents did. To understand how things have changed, we used government data to analyze the shares of today’s young adults reaching certain key milestones and how that compares with 30 years ago, when their parents were around the same age.
We looked at the following:
- College enrollment and completion
- Employment and wages
- Student loan and mortgage debt
- Marriage, kids and living arrangements
College enrollment and completion
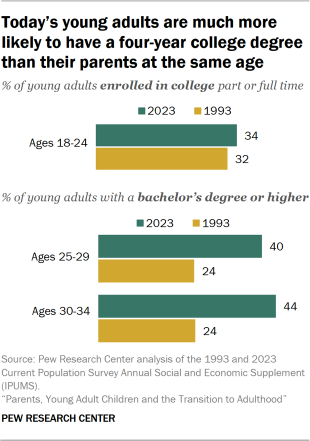
Young adults today are much more likely than their counterparts 30 years ago to be college graduates.
Among young adults ages 25 to 29 today, 40% have completed at least a bachelor’s degree. This share is slightly higher among adults ages 30 to 34 (44%). By comparison, only 24% of young adults ages 25 to 29 and 30 to 34 had a four-year college degree or more education in 1993.
Young women have made greater gains in this area than young men. From 1993 to 2023, the share of young women ages 25 to 34 with at least a four-year college degree rose from 23% to 47%. Among young men, the increase was smaller (from 24% to 38%).
The college enrollment rate for adults ages 18 to 24 has changed less dramatically over the past three decades, rising from 32% to 34%. There are gender differences here as well: Enrollment has risen from 33% to 38% among young women, while for young men it remained virtually unchanged (from 31% to 30%).
Over this period, college enrollment also increased among young adults ages 25 and older, which helped contribute to the rising shares of young adults with a bachelor’s degree.
Employment and wages
When it comes to the labor market, changes in employment among young adults have been less pronounced over the past 30 years.
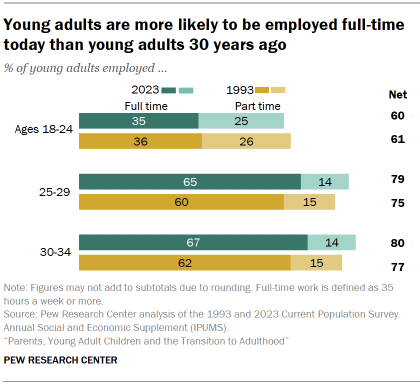
Compared with their parent’s generation, young adults today are more likely to work full time. These trends in employment can be connected to the fact that young adults in 1993 were coming out of a mild recession, while unemployment has been historically low in recent years.
While there hasn’t been a significant change among young adults ages 18 to 24, the share employed full time among young adults ages 25 to 29 increased from 60% in 1993 to 65% today. Similarly, among those ages 30 to 34, it rose from 62% to 67%.
These increases were driven by a larger share of women working full time (49% in 1993 vs. 58% today, among those ages 25 to 34). The share of young men ages 25 and older working full time remained unchanged over this period.
In addition, those 25 to 34 today are enjoying higher wages than their counterparts in 1993 (Figures are median annual earnings in 2022 dollars. Respondents reported earnings from the prior calendar year.):
- 18 to 24: $8,103 in 1993 versus $9,000 today
- 25 to 29: $28,939 versus $36,000
- 30 to 34: $32,797 versus $44,532
Wage gains can be partially explained by the higher education levels of today’s young adults. Young women across all age brackets still earn less than young men, but because the share of women with a bachelor’s degree has increased more than men’s, their wages have also risen more overall.
Student loan and mortgage debt
While today’s young adults have higher wages than young adults in the early 1990s, they’re also more likely to have outstanding debt. For this analysis, we used data from household heads from 1992 and 2022.
Student loans
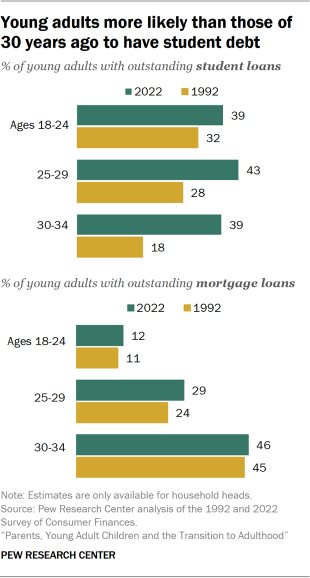
Today’s young adults are much more likely than young adults in the early 1990s to have outstanding student loans.
Among those ages 25 to 29, the share with student loans rose from 28% in 1992 to 43% in 2022, and the increase was even greater for 30- to 34-year-olds (from 18% to 39%). The change from 32% to 39% among those ages 18 to 24 is not statistically significant.
In addition to becoming more common, the value of student debt has soared – reflecting, in large part, the rising cost of a college education. While in 1992, the median amount owed on student loans (adjusted for inflation) ranged from $6,000 to $7,000 across age groups, these values increased considerably by 2022 among young adults ages 25 and older (to $16,000 for those 25 to 29, and to $20,000 among those 30 to 34).
Mortgage loans
The share of young adults with outstanding mortgage debt hasn’t changed significantly, but the median value of these loans has gone up.
Adjusted for inflation, young adults today have more mortgage debt compared with their counterparts in 1992:
- 18 to 24: $39,367 in 1992 versus $117,000 in 2022
- 25 to 29: $105,671 versus $165,000
- 29 to 34: $120,174 versus $190,000
Marriage, kids and living arrangements
Today’s young adults are getting married and forming families much later in life than young adults in previous generations.
The median age of adults at the time of their first marriage has risen, and a smaller share of young adults are married today compared with the past.
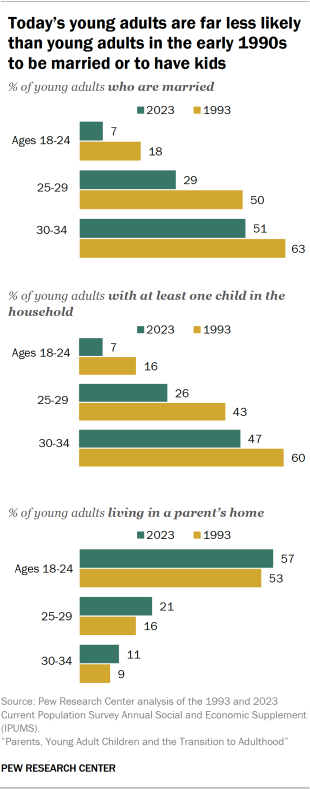
Among adults ages 18 to 24, only 7% were married in 2023, compared with 18% three decades earlier.
The falloff has been especially sharp among young adults ages 25 to 29: 29% were married in 2023, compared with 50% in 1993. The share married among those ages 30 to 34 dropped from 63% in 1993 to 51% today.
Young adults today are also less likely to have a child living in their household than their counterparts in 1993. These declines can be seen across all age groups (13 percentage points among those ages 30 to 34, 17 points for those ages 25 to 29, and 9 points among adults younger than 25).
Meanwhile, living with parents has become somewhat more common for young adults. Among those ages 18 to 24, 57% are living with a parent today, compared with 53% in 1993. The shares have also increased among those 25 and older.
CORRECTION (April 1, 2025): A previous version of the bar chart “Young adults are more likely to be employed full time today than young adults 30 years ago” included incorrect percentages for the shares employed full time and part time. In addition, the text of the report included incorrect figures for the shares of adults across age groups employed full time in 1993 and 2023, the shares of young women working full time in 1993 and 2023, and median annual earnings across age groups. The chart and text have been updated.


