
A slight majority of Americans (55%) say couples who are unhappy tend to stay in bad marriages for too long, compared with 43% who say these couples tend to get divorced too quickly.
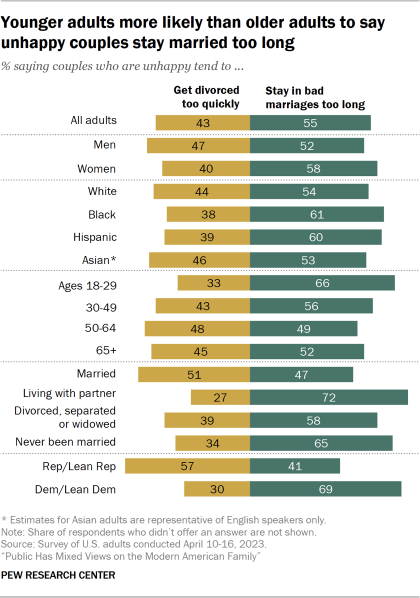
Women are more likely than men to say couples stay in bad marriages for too long (58% vs. 52%).
Views also vary by race and ethnicity, age, marital status, sexual orientation, and partisanship.
Race and ethnicity
About six-in-ten Black (61%) and Hispanic adults (60%) say unhappy couples stay in bad marriages for too long, while 54% of White adults and 53% of Asian adults say the same.
Age
Younger adults are the most likely to say couples tend to stay in bad marriages too long. Some 66% of those ages 18 to 29 say this, compared with 56% of adults 30 to 49 and about half of those 50 and older.
Women under 50 are particularly likely to say couples stay in bad marriages too long: 66% say this, compared with about half of women ages 50 and older and about half of men in both age groups.
Marital status
About seven-in ten unmarried adults living with a partner (72%) say couples stay in bad marriages for too long, while smaller shares of adults who have never been married (65%), who are divorced, separated or widowed (58%), and who are married (47%) say the same.
Sexual orientation
About three-quarters of lesbian, gay or bisexual adults (74%) say unhappy couples tend to stay in bad marriages too long compared with 54% of straight adults.
Partisanship and ideology
Democrats are more likely than Republicans to say couples tend to stay in bad marriages too long (69% vs. 41%).
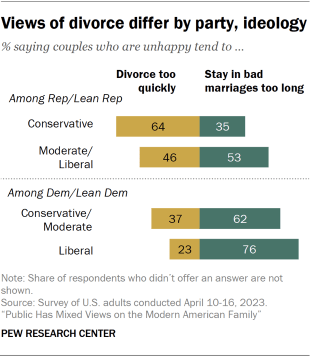
Among Republicans, there are wide ideological differences on views of divorce. While 53% of moderates and liberals in the party say unhappy couples tend to stay in bad marriages too long, 35% of conservatives say the same.
Majorities of Democrats across the ideological spectrum say couples stay in bad marriages too long, but liberals are more likely than conservatives and moderates to say this (76% vs. 62%).
Views of open marriages
Half of Americans say open marriages – a marriage where both spouses agree that they can date or have sex with other people – are somewhat or completely unacceptable. This includes 37% who say these marriages are completely unacceptable and 13% who say they’re somewhat unacceptable.
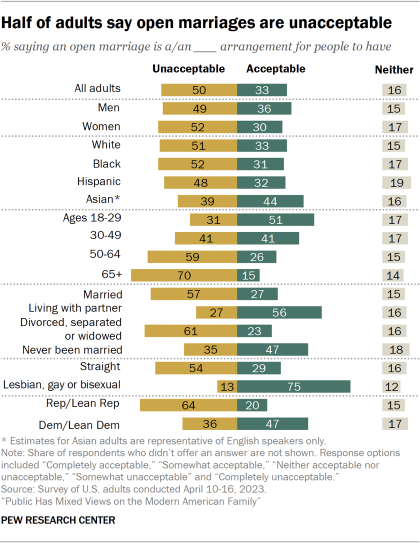
A third of Americans say these marriages are somewhat or completely acceptable (23% say completely acceptable and 11% say somewhat). The remainder (16%) say they are neither acceptable nor unacceptable.
Men are more likely than women to say open marriages are at least somewhat acceptable (36% vs. 30%).
Views of these marriages differ by race and ethnicity, age, marital status, and sexual orientation.
Race and ethnicity
Some 44% of Asian adults say open marriages are acceptable, compared with about a third among White (33%), Hispanic (32%) and Black adults (31%).
Age
Across age groups, young adults are the most likely to say open marriages are acceptable, and older adults are the most likely to say they’re unacceptable. About half of adults under age 30 (51%) say open marriages are acceptable. The shares go down steadily with age. Fewer than half of those ages 30 to 49 (41%) say these marriages are acceptable, as do 26% of those 50 to 64 and 15% of those 65 and older. And 70% of adults 65 and older say these marriages are unacceptable.
Marital status
Married adults (57%) and those who are divorced, separated or widowed (61%) are more likely than those who are living with a partner (27%) or have never been married (35%) to say open marriages are unacceptable. In fact, those who are living with a partner are the most likely to say these kinds of marriages are acceptable (56%).
Sexual orientation
Lesbian, gay or bisexual adults are far more likely than straight adults to say open marriages are acceptable (75% vs. 29%). These differences remain even when considering the fact that lesbian, gay or bisexual adults tend to be younger than straight adults.
Partisanship
A majority of Republicans (64%) say open marriages are unacceptable, while 20% say they are acceptable. Views among Democrats are more mixed: 47% say these kinds of marriages are acceptable and 36% say they are unacceptable. As may be expected, conservative Republicans are the most likely to say these marriages are unacceptable (74%), while liberal Democrats are the most likely to say they are acceptable (63%).


