
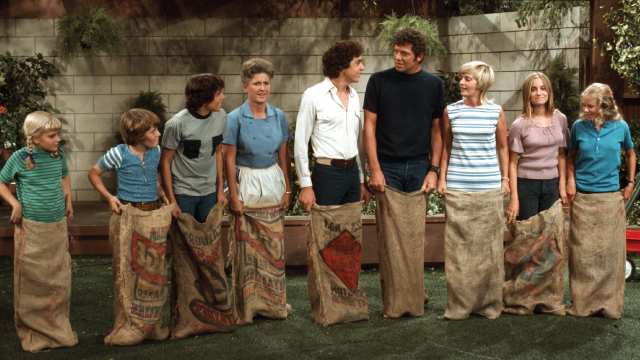
When people think of “blended families,” they might think of something like “The Brady Bunch”– when two people marry and each bring in children from a past relationship. But that’s just one type of blended family. The term refers to any family that includes a stepparent, stepsiblings and/or half siblings.
Some 17% of U.S. children younger than 18 live in a blended family. This figure is based on family members that children live with most or all of the time. It’s important to note that some children may have blended family members who are not accounted for, like a stepsibling who lives in another household or an older half sibling who has moved out.
Here are five facts about blended families, based on a Pew Research Center analysis of data from the U.S. Census Bureau.
The likelihood of living in a blended family varies by race and ethnicity, parent education, and age. Across racial and ethnic groups, Black children are the most likely to live in a blended family (28%), followed by Hispanic (19%) and White children (15%). Asian children are the least likely to live in a blended family (7%).
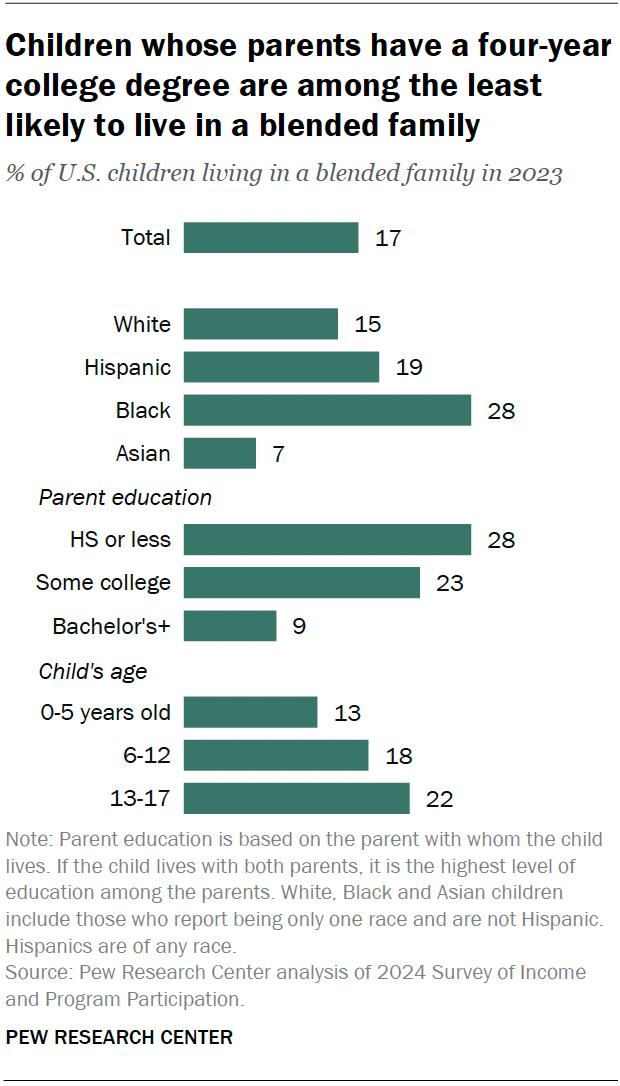
Children whose parents have a bachelor’s degree or more education are less likely than children whose parents have less education to live in a blended family. Here, we count the education level of the parent the child lives with, or the highest level of education if the child lives with both parents.
Throughout this analysis, “parents” refer to biological or adoptive parents.
Some 28% of children with a parent who has a high school diploma or less education and 23% of those with a parent who has some college education live in a blended family. This share (9%) is much lower for children with a parent who has a bachelor’s degree or more education.
This may be the case because adults with a bachelor’s degree are less likely to have children outside of marriage and less likely to divorce.
Related: 8 facts about divorce in the United States
Teens (ages 13 to 17) are the most likely to live in a blended family (22%), followed by children ages 6 to 12 (18%), and children ages 5 and younger are the least likely (13%).
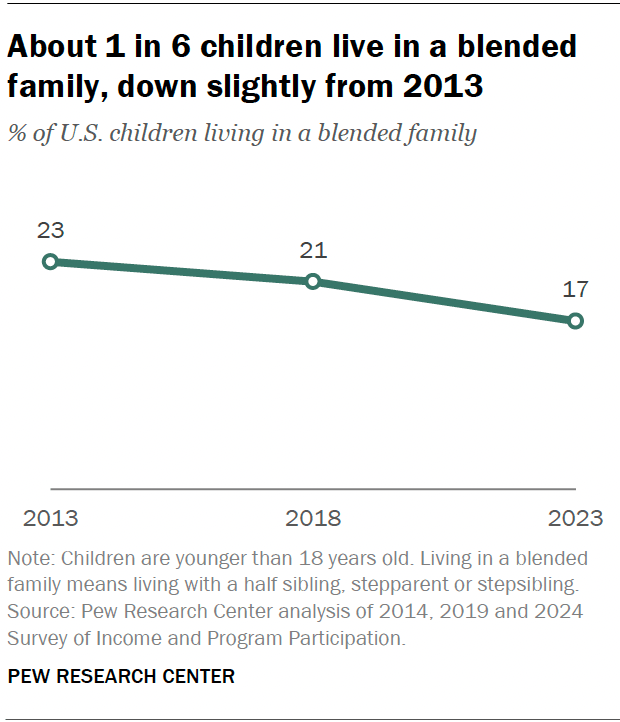
The share of U.S. children living in a blended family is down slightly from 2013. Some 17% of children live in a blended family as of 2023, compared with 23% in 2013.
This drop happened mostly because the share of children living with a half sibling fell from 17% to 12%. In particular, a smaller share of children now live with half siblings, just one parent and no stepparents.
This arrangement usually happens when a parent has children with multiple partners, sometimes outside of marriage. This decline fits in with more recent demographic trends, like falling birth rates among people in their teens and early 20s. Typically, people who have children at younger ages and outside of marriage are more likely to have children with multiple partners.
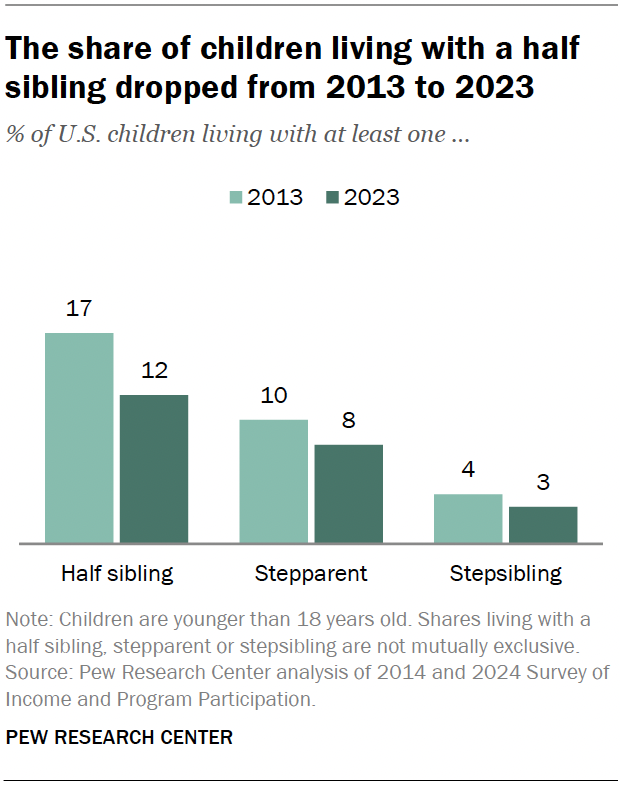
The shares of children living with a stepparent and at least one stepsibling didn’t change much between 2013 and 2023. A stepparent can be the spouse or unmarried cohabiting partner of the child’s parent.
Living with half siblings, a stepparent or stepsiblings aren’t mutually exclusive arrangements. Many children in blended families live with more than one of these kinds of relatives.
There is no typical arrangement that defines a blended family. Nearly half of children in blended families (46%) live with a parent and a stepparent, with or without half siblings or stepsiblings. This includes 33% who live with their mother and a stepparent and 13% who live with a father and a stepparent.
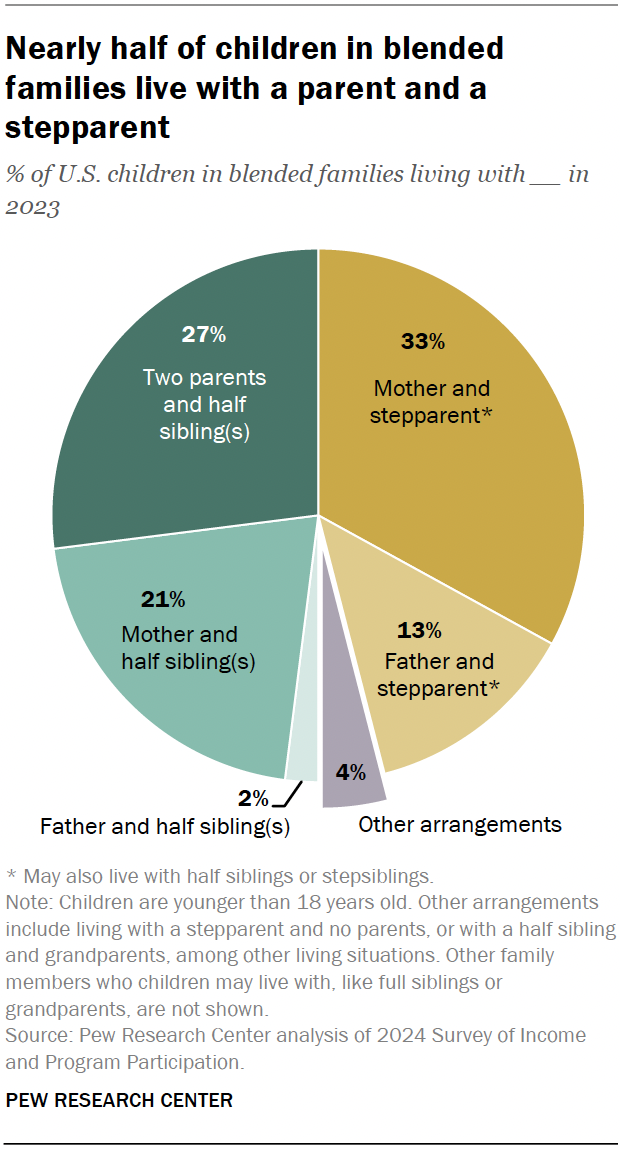
On the other hand, 50% of children in blended families don’t live with a stepparent but do live with at least one half sibling. For example, 27% of children in blended families live with both parents and at least one half sibling. This often occurs when a child lives with an older half sibling from a parent’s previous relationship. Another 23% live with a single parent (usually their mother) and at least one half sibling.
Among children who live with a parent and a stepparent, 66% live with a parent and stepparent who are married to each other. Another 34% live with a parent and stepparent who are not married.
Among children living with a parent and a stepparent, some also live with half siblings and/or stepsiblings:
- 27% live with half siblings only.
- 15% live with stepsiblings only.
- 14% live with both half and stepsiblings.
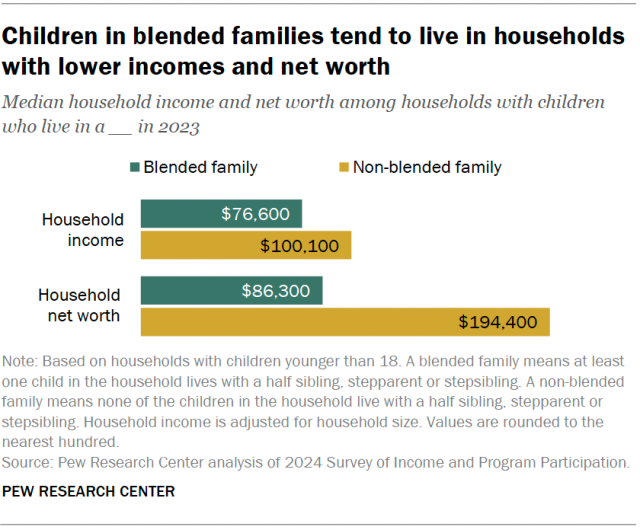
Blended families tend to have lower household incomes and wealth than non-blended families. For example, the median net worth for households with children in blended families is $86,300. This is much lower than the $194,400 for households with children who aren’t in blended families. (Non-blended families mostly include children who live with one or both of their parents, with or without full siblings.)
What drives these financial differences?
- Education is strongly linked with income and wealth. Parents of children in blended families tend to have lower levels of education than parents in non-blended families. For example, 24% of children in blended families have a parent with a bachelor’s degree, compared with 53% of children in non-blended families.
- Homes are most Americans’ largest assets. Blended families are less likely than non-blended families to own a home (55% vs. 66%). And among homeowners, blended families have less home equity than non-blended families ($132,000 vs. $195,000 at the median).
Among blended families with a child support agreement, 64% get cash payments. Child support payments typically happen between parents when the child lives with one parent and not the other.
Overall, 46% of blended families that have at least one child living with one parent but not the other have a formal or informal child support agreement. Formal agreements are court-ordered and legally obligated, while informal agreements are agreed upon between parents.
Blended families who have cash support agreements and receive payments get a median of $400 monthly (in 2023 U.S. dollars). This is 12% of their monthly household income, on average.
In addition, among blended families with children who live with one parent but not the other, 15% receive in-kind support. This type of support includes non-monetary items like food, school supplies and clothes. Families with or without agreements may receive in-kind support.
(This portion of the analysis combines data from 2022 and 2023 due to sample size limitations.)
Note: Read the methodology for more information on the dataset and how we calculated specific statistics.
